
Hey, Phoenix homeowners and potential buyers! Ready for your weekly real estate check-in? Here’s the news, listings, open houses, events and more! Reach out if you have any specific questions! Enjoy!
Phoenix-Area Real Estate News
Let’s dive into the recent market movements and see where the Valley of the Sun stands.
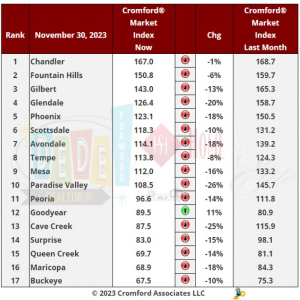
Positive Momentum: The Cromford® Market Index (CMI) took a positive turn, with an average decline of 13.1% across 17 cities. The good news? It’s an improvement compared to the 15.2% dip we saw last week, signaling a more robust shift in the market.
City Showdown: While some cities basked in positivity, the majority faced challenges. Paradise Valley, Cave Creek, Glendale, Phoenix, Surprise, Mesa, Peoria, Maricopa, Queen Creek, and Avondale experienced declines. However, the standout performer? Goodyear, marching towards a balanced status, escaping its buyer’s market label.
Bright Spots: Chandler, Fountain Hills, and Tempe held their ground, showing resilience. Scottsdale and Buckeye also made strides in the right direction, marking notable improvements.
Market Dynamics: Currently, 9 out of 17 cities remain sellers’ markets. Paradise Valley and Peoria enjoy a balanced zone, while Cave Creek, Surprise, Buckeye, Goodyear, Queen Creek, and Maricopa fall into buyers’ markets. Maricopa, Queen Creek, and Buckeye have dipped below 70, giving buyers a robust advantage. Sellers face stiff competition due to the influx of new homes in these areas.
Trends on the Horizon: Encouragingly, we’re witnessing a gradual uptick in demand trends. Most areas have experienced a halt in supply increase, aligning with our expectations post-Thanksgiving. As we navigate these shifts, stay tuned for more updates on the Phoenix real estate landscape. Whether you’re a seller, buyer, or just a curious onlooker, understanding these trends can make all the difference in your real estate journey. Let’s keep our eyes on the market pulse, Phoenix! 🌵
Concise Market Snapshot
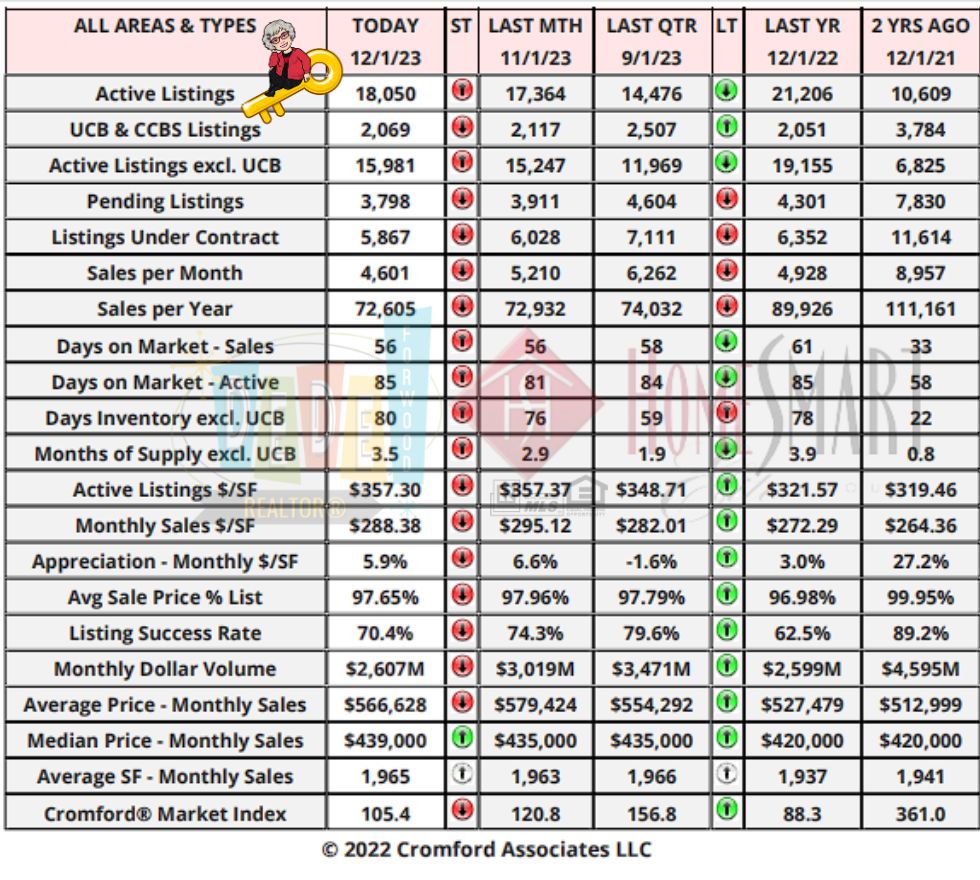
This table provides a concise statistical summary of today’s residential resale market in the Phoenix metropolitan area.
The figures shown are for the entire Arizona Regional area as defined by ARMLS. All residential resale transactions recorded by ARMLS are included. Geographically, this includes Maricopa county, the majority of Pinal county and a small part of Yavapai county. In addition, “out of area” listings recorded in ARMLS are included, although these constitute a very small percentage (typically less than 1%) of total sales and have very little effect on the statistics.
All dwelling types are included. For-sale-by-owner, auctions and other non-MLS transactions are not included. Land, commercial units, and multiple dwelling units are also excluded.
BankRate Mortgage Rates:
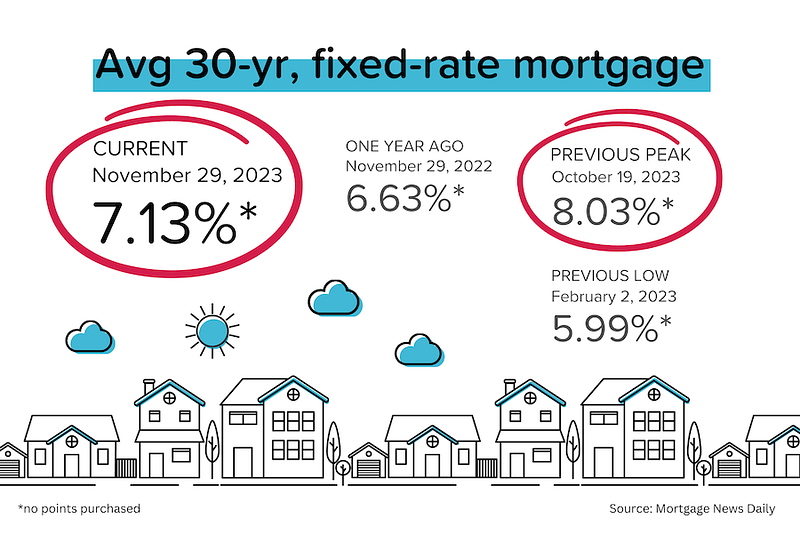
On Friday, December 01, 2023, the current average interest rate for a 30-year fixed mortgage is 7.57%, down 17 basis points since the same time last week. If you’re looking to refinance, today’s national average 30-year refinance interest rate is 7.69%, down 5 basis points since the same time last week. Meanwhile, the current average 15-year fixed refinance interest rate is 6.95%, falling 18 basis points compared to this time last week.
New Listings:
New to the Market


 MLS IDX Listing Disclosure © 2024
Copyright 2024 Arizona Regional Multiple Listing Service, Inc. All rights reserved. Information Not Guaranteed and Must Be Confirmed by End User. Site contains live data.
Upcoming Open Houses:
Don’t forget to bring me!
Open Houses this Weekend


MLS IDX Listing Disclosure © 2024
Copyright 2024 Arizona Regional Multiple Listing Service, Inc. All rights reserved. Information Not Guaranteed and Must Be Confirmed by End User. Site contains live data.
Recent Price Changes:
Recent Price Changes


MLS IDX Listing Disclosure © 2024
Copyright 2024 Arizona Regional Multiple Listing Service, Inc. All rights reserved. Information Not Guaranteed and Must Be Confirmed by End User. Site contains live data.
Featured Listings:
Featured Listings

MLS IDX Listing Disclosure © 2024
Copyright 2024 Arizona Regional Multiple Listing Service, Inc. All rights reserved. Information Not Guaranteed and Must Be Confirmed by End User. Site contains live data.
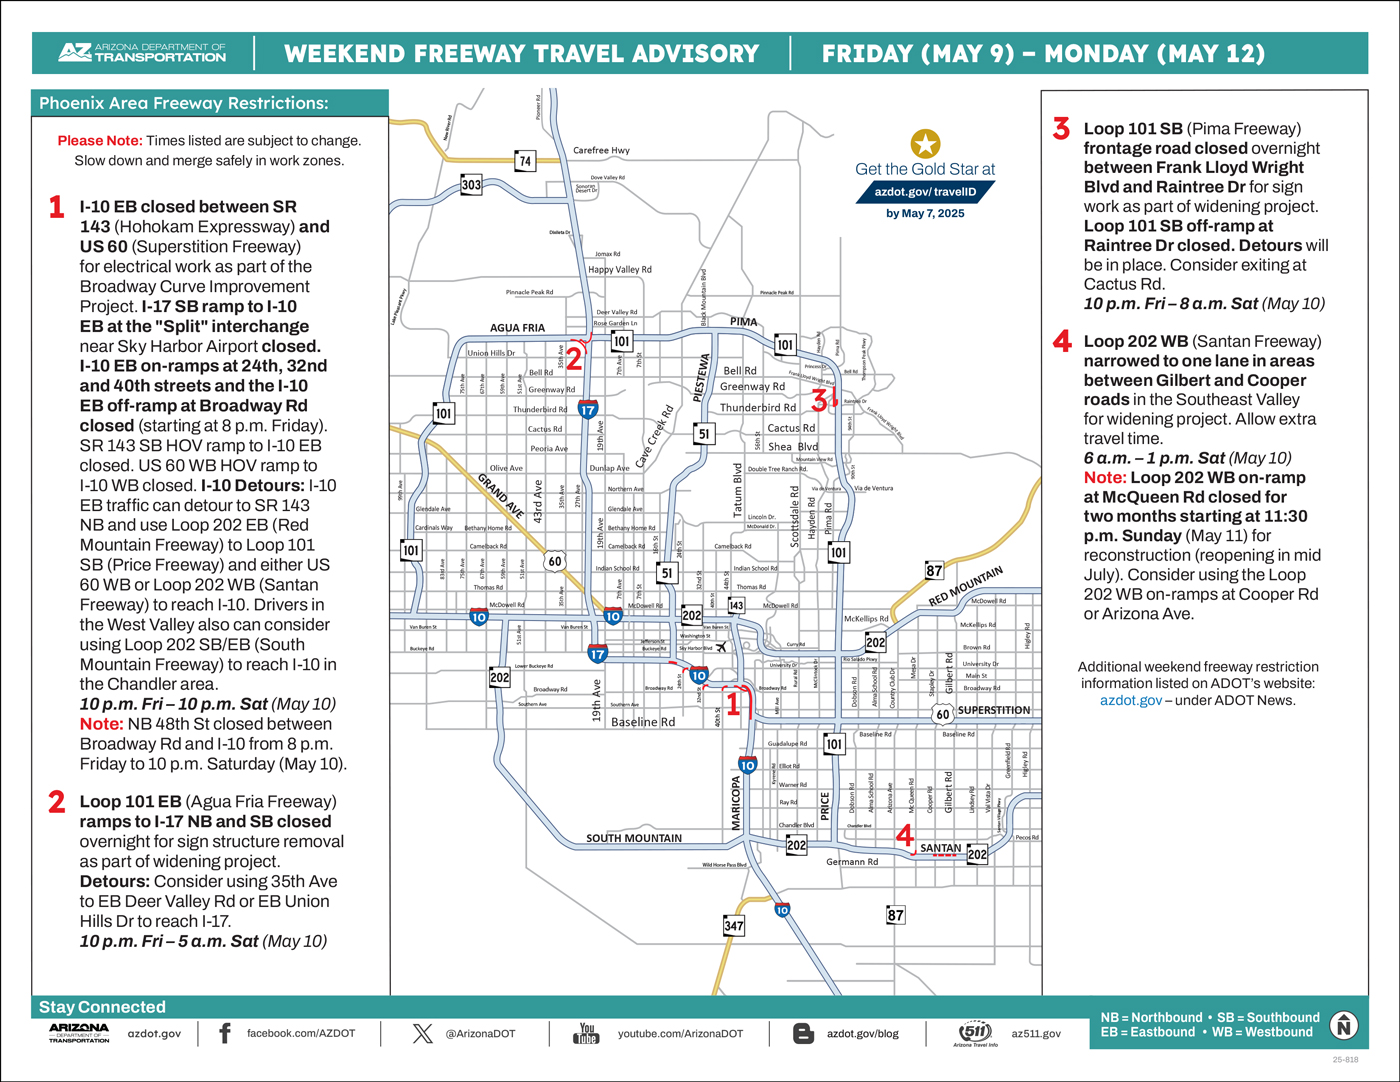
ADOT: No weekend freeway closures in Phoenix area (Dec. 1-4) Drivers should use caution with work still possible near freeways.
PHOENIX – No closures for ongoing improvement projects are scheduled along Phoenix-area freeways this weekend (Dec. 1-4), according to the Arizona Department of Transportation.
To limit impacts on traffic, shopping and the delivery of products during the holiday travel season, ADOT and its contractors schedule work to avoid full freeway closures through New Year’s weekend.
With work still planned near freeways, including during overnight hours, drivers should remain alert, use caution and be prepared to slow down when approaching and traveling through any existing work zones.
Work zones remain in place for the I-10 Broadway Curve Improvement Project in the Phoenix area and the I-17 widening project between Anthem and Sunset Point.
Real-time highway conditions are available on ADOT’s Arizona Traveler Information site at az511.gov and by calling 511. Information about highway conditions also is available through ADOT’s Twitter feed, @ArizonaDOT.
Valley of the Sun Sold Listings
- 5916,6270,5576,5205,4634,4926,4436,5761,6769,7050,7599,6327
Information is deemed to be reliable, but is not guaranteed. © 2024
Valley of the Sun Inventory
- 13667,13611,15052,16629,18112,17891,17761,18844,19812,19757,20076,20421
- 7047,8018,8063,8266,7017,5389,9212,8990,9822,9620,9476,8182
Information is deemed to be reliable, but is not guaranteed. © 2024
Valley of the Sun New Listings
- 7047,8018,8063,8266,7017,5389,9212,8990,9822,9620,9476,8182
Information is deemed to be reliable, but is not guaranteed. © 2024
Valley of the Sun Pending Listings
- 5838,5813,5011,4867,4564,4423,6396,6528,7301,7186,6598,5222
Information is deemed to be reliable, but is not guaranteed. © 2024
Valley of the Sun Absorption Rate
- 2.2,2.2,2.44,2.73,2.98,2.95,2.94,3.12,3.28,3.3,3.34,3.42
Information is deemed to be reliable, but is not guaranteed. © 2024
Valley of the Sun Sale to Original List Price Ratio
- 96.7,96.6,96.8,96.6,96.0,95.3,95.5,96.1,96.2,96.1,96.2,96.1
Information is deemed to be reliable, but is not guaranteed. © 2024
Valley of the Sun Average Days on Market
- 58.5,57.6,55.5,55.8,57.4,61.6,68.4,68.7,67.2,65.9,64.7,65.1
Information is deemed to be reliable, but is not guaranteed. © 2024
Valley of the Sun New Listings Volume
- 4289205940,4923409677,5372295331,5635633115,4620559706,3432600239,6702070505,6023514236,6579093151,6385170824,6148997866,5077754713
Information is deemed to be reliable, but is not guaranteed. © 2024
National Real Estate News:
Housing starts improved slightly. Based on October starts, builders are on pace to deliver 1.4 million new housing units over the next 12 months, 70% of which are single family homes. But don’t forget that there is a record amount of multifamily units already under construction and nearing completion. [Census Bureau]
Existing home sales for October fell 4% MoM to an annualized rate of 3.79 million, a 13-year low. Since January 2022 (when existing home sales were 6.34 million SAAR), existing home sales have plunged 40%! Sounds terrible, right? But here’s the good news: I wouldn’t be surprised if this is the bottom for this 20-month downturn. More on this later. [NAR]
The Realtor’s Confidence Index for October didn’t show much confidence, with only 7% of agents saying that they expected a YoY increase in buyer or seller traffic in the next 3 months. That said, 66% of homes sold in October were on the market less than a month, 28% of homes sold above their listing price, and there was an average of 2.5 offers per home sold. [NAR]
Builder confidence may have cratered, but new home sales remain strong. In October, new homes sold at an annualized pace of 679,000 units. That’s 6% below September 2023, but 18% above Oct 2022. [Census Bureau]
The media made a big deal out of the 18% YoY drop in median new home prices, but that’s mostly due to “mix.” In October 2022, 49% of new homes sold were priced above $500,000. By October 2023, this had fallen to 32%. Builders are redrawing plans and delivering smaller/more affordable homes, and that’s pulling the median down.

Case-Shiller: Home prices just keep rising. National home prices climbed 0.7% MoM in September, the 8th-straight monthly increase. All 20 big city indexes saw MoM increases, and 13 set new all-time highs. [S&P Global CoreLogic]
FHFA: Yup, we’re seeing the same thing. On FHFA’s (slightly different) numbers, national home prices rose 0.6% MoM in Sept, the 13th-straight monthly increase. All regions except the Pacific saw prices rise. [FHFA]
Rents are now LOWER than last year! Rental rates always fall (month over month) in winter — it’s a seasonal thing. But for rents to now be down 1.1% YoY is unusual. It’s also a very promising sign that overall inflation levels will continue to ease. [Apartment List]
Inflation dropping closer to target! “Headline” PCE dropped from 3.4% YoY in Sep to 3.0% YoY in Oct, while “core” PCE eased from 3.7% to 3.5%. The recent fall in oil/gas prices helped the headline figure, while the continuing decline in “shelter” cost growth was a tailwind for core PCE. As a reminder, the Fed’s target for core PCE is 2%. [BEA]
Pending home sales hit by rate rise. October pending sales (contract signings) fell 1.5% MoM, as mortgage rates rose to above 8% during the month. Contract signings were at the lowest level in more than 20 years. This suggests that existing home sales for November will be around 3.8 million. [NAR]
On the Case (Shiller)
All figures quoted here are seasonally adjusted.
Home prices continued to rise in September, with the national index up 0.7% MoM. That’s the 8th-straight monthly increase. Year-to-date, the national index is now up 4.6%, which annualizes at 6.1%.
As Craig Lazarra, Managing Director at S&P DJI noted, “[this] is well above the median full calendar year increase in more than 35 years of data. Although this year’s increase in mortgage rates has surely suppressed the quantity of homes sold, the relative shortage of inventory for sale has been a solid support for prices. Unless higher rates or exogenous events lead to general economic weakness, the breadth and strength of this month’s report are consistent with an optimistic view of future results.”
In other words, unless something breaks, prices are likely to keep rising. And the positive price momentum is extremely broad-based:
- On a seasonally-adjusted basis, all 20 big city indexes saw prices rise MoM.
- On a non-seasonally-adjusted basis, 15 big city indexes saw price rise MoM. [Remember: It’s totally normal for prices to fall in winter, so the fact that only 5-out-of-20 did is notable.]
- As we predicted last month, the Los Angeles, San Diego, and Tampa indexes set new, all-time highs in September, having erased the declines seen in the 2H of 2022.
- That means that 13-out-of-20 big city indexes are now setting new, all-time highs each month.
- Year-to-date, the San Diego index is up 8.2%, the Detroit index +7.0%, and the New York City index +6.9%.
- Of the 7 big city indexes that are still below their mid-2022 peaks, only San Francisco (-8.7%) and Seattle (-6.6%) remain significantly in the hole. But if current trends continue, both could be hitting new highs by mid-2024.
Arizona Case-Shiller Insight:
Phoenix on the Rise: Phoenix continues to shine, boasting a higher index for the seventh consecutive month. Among the 20 cities surveyed, 15 showed rising prices last month, cementing Phoenix’s position as a real estate hotspot.We have 15 of the 20 cities showing rising prices for last month, with a higher index for Phoenix for the seventh month in a row. However 5 cities declined over the last month. Comparing with the previous month’s series we see the following changes:
4. Phoenix +0.54%
Phoenix has risen from 6th to 5th place since last month. The national average increase month to month was +0.30%, so Phoenix remains comfortably ahead of that standard.
Comparing year over year, we see the following changes:
Detroit +6.7% San Diego +6.5% New York +6.3% Chicago +6.0% Boston +5.3% Los Angeles +5.2% Cleveland +5.1% Miami +5.0% Charlotte +4.7% Washington +4.4% Atlanta +4.3% Minneapolis +2.4% Tampa +1.5% Denver +1.0% Seattle +0.9% San Francisco +0.5% Dallas +0.3% Portland -0.7% Phoenix -1.2% Las Vegas -1.9%
Phoenix lies once again in 19th place, and among the weakest cities on a year over year basis. 17 of the 20 cities are now showing positive price movement from one year ago and once again the northern cities are looking good on the year over year measure, along with Southern California. The national average is +3.9% year over year. We can see that Phoenix pricing has been much weaker than the national average between 3Q 2022 and 3Q 2023. We can also see that those predicting a nationwide housing crash over the 12 months were wrong. No surprise there.
I’m be a lot more bullish right now.
Inventory levels have continued to rise (not normal this time of year) and mortgage rates have recently dropped from above 8% to nearly 7.1%. The Fed has almost certainly stopped raising short-term interest rates, and may start cutting rates as early as May 2024.
I wouldn’t be surprised if the existing home sales for October 2023 (3.79 million units on a seasonally-adjusted, annualized basis) proves to be the bottom for this 20-month downturn. Since January 2022 (when existing home sales were 6.34 million SAAR), existing home sales have plunged 40%!
The NAR itself forecasts 15% recovery in existing home sales in 2024, driven in large part by their assumption that 30-year mortgage rates will drop below 7% by the 2024 spring selling season. (And we’re almost there already on rates!)

Mortgage Market
Average 30-year mortgage rates continued to trend downward, now approaching 7%. The most recent drop was driven by: 1) surprisingly “dovish” comments from habitual Fed “hawk” Christopher Waller, and 2) better-than-expected PCE (inflation) figures.
Reminder: “Hawks” want higher interest rates and are concerned about high inflation and tight labor markets. They’re less worried about economic growth. “Doves” want lower interest rates because they are concerned about slowing growth and recession risks.
“I am increasingly confident that policy is currently well-positioned to slow the economy and get inflation back to 2%…[if the decline in inflation continues] for several more months…three months, four months, five months…we could start lowering the policy rate just because inflation is lower. It has nothing to do with saving the economy. It is consistent with every policy rule. There is no reason to say that we will keep [the policy rate] really high.” — Christopher Waller
Here’s your links for this weekend’s events!

My Website always has a list of what’s upcoming. Go here and maybe I’ll see you out there!
|
|

|


|


|


|


|


|


|


|


|


|


|


|


|


|

|

|
|

|

|

Get your Home Value, wealth Snapshot and Ideas what to do with your Equity Every Month!

Join DeDe’s Secret Private Facebook group for tips, tricks, discounts and Freebies!

DeDe’s Social Media: Click on picture to read/watch

See you next Week!
DeDe