Here’s the news, listings, open houses, events and more! Reach out if you have any specific questions! Enjoy!
Phoenix-Area Real Estate News
Cromford Market Index
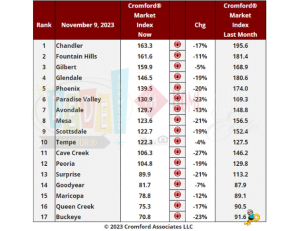
Based on the numbers in this table. the market is still weakening at a fast rate, with an average decline of 16.3% in the Cromford® Market Index for the 17 cities above. This is worse than the 15.8% decline we saw last week.
Well above average declines in CMI can be seen in Cave Creek, Buckeye, Mesa, Scottsdale, Paradise Valley, Surprise and Phoenix. The slowest declines are to be found in Gilbert, Goodyear and Tempe.
10 out of 17 cities are still sellers markets with Peoria and Cave Creek in the balanced zone while Surprise, Buckeye, Goodyear, Queen Creek and Maricopa are all buyers’ markets. Maricopa has joined Queen Creek and Buckeye below the 80 level. Among the secondary cities, Casa Grande and Gold Canyon are also below 80 while Litchfield Park is below 90.
Tolleson, Laveen, Sun Lakes, Anthem, El Mirage and Apache Junction are the strongest of the secondary cities, all with CMIs over 180.
Despite the above, we are just starting to see a slight tick-up in some of the listings-under-contract numbers, as the market reacts to the very recent decline in mortgage rates since the start of November.
Monthly Average Sales Price Per Square Foot
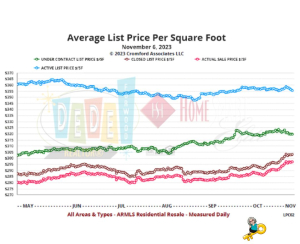
The active listing $/SF is lower than it was 6 months ago, but that follows the usual seasonal pattern with a weak 3Q followed by a mild recovery. The current trend is pretty flat with optimistic new listing prices being balanced by price cuts for existing listings that remain on the market for more than a few weeks.
Under contract $/SF is a lot higher than it was 6 months ago, around $320 compared with $302, a rise of around 6%. However the trend for the last month has flattened.
The list $/SF for closed listings stands at $303, up from $287 six months ago, a rise of just under 6%.
The sale $/SF for closed listings stands at $297, up from $280 six months ago, a rise of just over 6%.
Closed listings are achieving a slightly higher percentage of the final asking price compared with 6 months ago. It is up from 97.58% to 97.97%, a positive sign.
Since the end of August the gap between the under contract line (green) and the closed line (brown) has been too big. When this happens, it is safe to predict the gap will close. In this case, prices for closed listings rose significantly while under contract prices remained stable. The gap is now back to normal. Closed prices are unlikely to rise much further from this point unless under contract prices establish an upward trend again. Given the balance between supply and demand, it seems more likely that under contract pricing will weaken, but we will have to wait and see what recent moves in interest rate do to buyer enthusiasm.
Concise Market Snapshot
BankRate Mortgage Rates:
On Friday, November 10, 2023, the current average interest rate for the benchmark 30-year fixed mortgage is 7.87%, decreasing 7 basis points over the last seven days. If you’re looking to refinance, today’s current average interest rate for a 30-year fixed refinance is 8.00%, decreasing 5 basis points over the last seven days. Meanwhile, the national 15-year refinance interest rate is 7.37%, down 2 basis points compared to this time last week.
New Listings:
New to the Market
 MLS IDX Listing Disclosure © 2024
Copyright 2024 Arizona Regional Multiple Listing Service, Inc. All rights reserved. Information Not Guaranteed and Must Be Confirmed by End User. Site contains live data.
Upcoming Open Houses:
Don’t forget to bring me!
Open Houses this Weekend
 MLS IDX Listing Disclosure © 2024
Copyright 2024 Arizona Regional Multiple Listing Service, Inc. All rights reserved. Information Not Guaranteed and Must Be Confirmed by End User. Site contains live data.
Recent Price Changes:
Recent Price Changes
 MLS IDX Listing Disclosure © 2024
Copyright 2024 Arizona Regional Multiple Listing Service, Inc. All rights reserved. Information Not Guaranteed and Must Be Confirmed by End User. Site contains live data.
Featured Listings:
Featured Listings
 MLS IDX Listing Disclosure © 2024
Copyright 2024 Arizona Regional Multiple Listing Service, Inc. All rights reserved. Information Not Guaranteed and Must Be Confirmed by End User. Site contains live data.
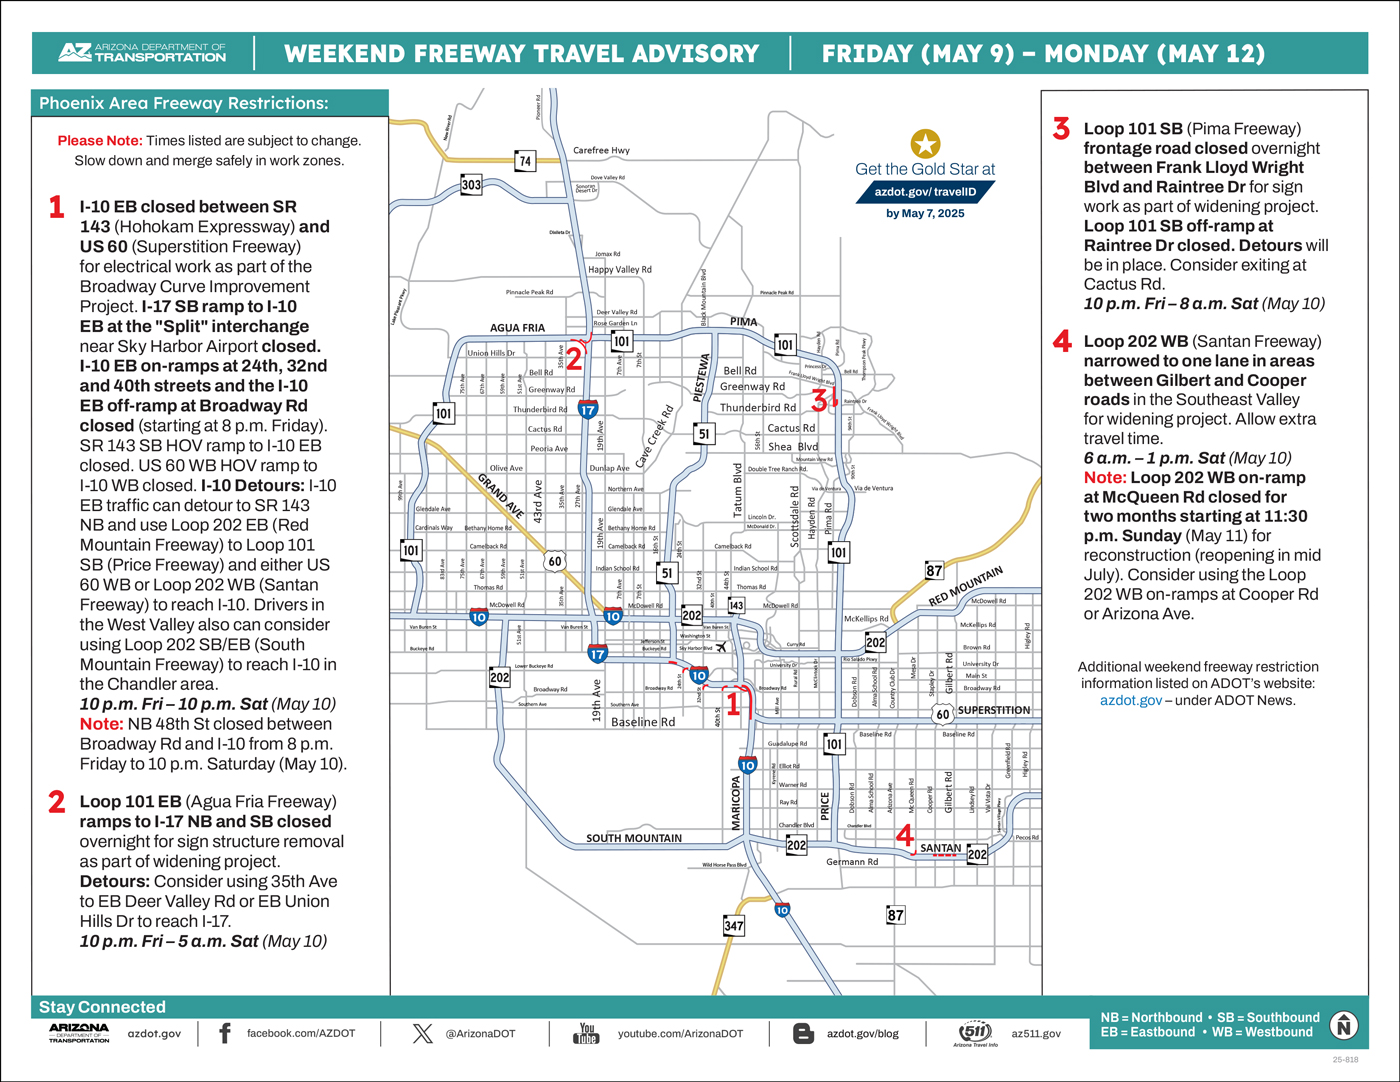
ADOT’s Weekend Freeway Travel Advisory (Nov. 10-12) – Phoenix Area
Plan for closures of sections of westbound I-10, southbound I-17
PHOENIX – Stretches of Interstate 10 and Interstate 17 in Phoenix will be closed this weekend (Nov. 10-13) for improvement projects managed by the Arizona Department of Transportation and Valley Metro. Drivers should consider using alternate routes if necessary while the following weekend closures are in place:
- Westbound I-10 closed between Seventh Street and Seventh Avenue north of downtown Phoenix from 10 p.m. Friday to 10 a.m. Sunday (Nov. 12) for scheduled bridge inspection work at the I-10 tunnel. Southbound SR 51 and westbound Loop 202 ramps to westbound I-10 at the “Mini-Stack” interchange closed. Westbound I-10 on-ramp at 16th Street closed. Westbound Loop 202 on-ramps at 32nd and 24th streets closed.
- Detours: Consider using northbound I-17 starting at the “Split” interchange near Sky Harbor Airport to reach I-10 beyond the closure. Drivers exiting westbound I-10 at Seventh Street can use westbound McDowell Road or Van Buren Street to Seventh Avenue.
- Southbound I-17 closed between Peoria and Dunlap avenues from 10 p.m. Friday to 10 p.m. Sunday (Nov. 12) for Valley Metro’s light rail bridge construction project. Southbound I-17 on-ramps at Greenway, Thunderbird and Cactus roads closed. Southbound I-17 frontage road closed between Peoria and Dunlap avenues.
- Detours: Loop 101 to southbound State Route 51 is an alternate freeway route to the Sky Harbor Airport area. Southbound I-17 drivers also can consider exiting ahead of the closure and using southbound 19th or 35th avenues to travel beyond closure.
- Westbound I-10 ramp to northbound SR 143 (Hohokam Expressway) closed from 3 a.m. to 3 p.m. Sunday (Nov. 12) for the I-10 Broadway Curve Improvement Project.
- Detours: Consider alternate routes including westbound I-10 to eastbound Loop 202 (Red Mountain Freeway) to reach southbound SR 143. Sky Harbor Airport access: Consider exiting westbound I-10 to northbound 24th Street or eastbound Buckeye Road to enter the airport from the west.
Schedules are subject to change due to inclement weather or other factors. ADOT plans and constructs new freeways, additional lanes and other improvements in the Phoenix area as part of the Regional Transportation Plan for the Maricopa County region. Most projects are funded in part by Proposition 400, a dedicated sales tax approved by Maricopa County voters in 2004.
Real-time highway conditions are available on ADOT’s Arizona Traveler Information site at az511.gov and by calling 511. Information about highway conditions also is available through ADOT’s Twitter feed, @ArizonaDOT.
Valley of the Sun Sold Listings
- 5916,6270,5576,5205,4634,4926,4436,5761,6769,7050,7599,6327
Information is deemed to be reliable, but is not guaranteed. © 2024
Valley of the Sun Inventory
- 13667,13611,15052,16629,18112,17891,17761,18844,19812,19757,20076,20421
- 7047,8018,8063,8266,7017,5389,9212,8990,9822,9620,9476,8182
Information is deemed to be reliable, but is not guaranteed. © 2024
Valley of the Sun New Listings
- 7047,8018,8063,8266,7017,5389,9212,8990,9822,9620,9476,8182
Information is deemed to be reliable, but is not guaranteed. © 2024
Valley of the Sun Pending Listings
- 5838,5813,5011,4867,4564,4423,6396,6528,7301,7186,6598,5222
Information is deemed to be reliable, but is not guaranteed. © 2024
Valley of the Sun Absorption Rate
- 2.2,2.2,2.44,2.73,2.98,2.95,2.94,3.12,3.28,3.3,3.34,3.42
Information is deemed to be reliable, but is not guaranteed. © 2024
Valley of the Sun Sale to Original List Price Ratio
- 96.7,96.6,96.8,96.6,96.0,95.3,95.5,96.1,96.2,96.1,96.2,96.1
Information is deemed to be reliable, but is not guaranteed. © 2024
Valley of the Sun Average Days on Market
- 58.5,57.6,55.5,55.8,57.4,61.6,68.4,68.7,67.2,65.9,64.7,65.1
Information is deemed to be reliable, but is not guaranteed. © 2024
Valley of the Sun New Listings Volume
- 4289205940,4923409677,5372295331,5635633115,4620559706,3432600239,6702070505,6023514236,6579093151,6385170824,6148997866,5077754713
Information is deemed to be reliable, but is not guaranteed. © 2024
National Real Estate News
Mortgage rates continued to drift lower, with the average 30-yr mortgage dropping below 7.5%. And home prices continued to rise in ~80% of the metros nationwide. It’s still a very tight market, but there are some early signs of improving inventory.
October jobs data shows hiring slowdown. The US added only 150,000 jobs in October, and the figures for the prior two months were revised lower by 101,000. This weaker-than-expected report, which came out Friday last week, helped to push US treasury yields (and mortgage rates) lower. [Bureau of Labor Statistics].
CoreLogic: YoY price growth accelerates. In Sep 2023, home prices rose 0.3% MoM, the 8th-straight month of increases. Compared to Sep 2022, prices were +4.5% YoY, an acceleration from +3.7% YoY in Aug. Keep in mind, however, that home prices were generally falling this time last year, so the improving YoY figure is to be expected. [CoreLogic]
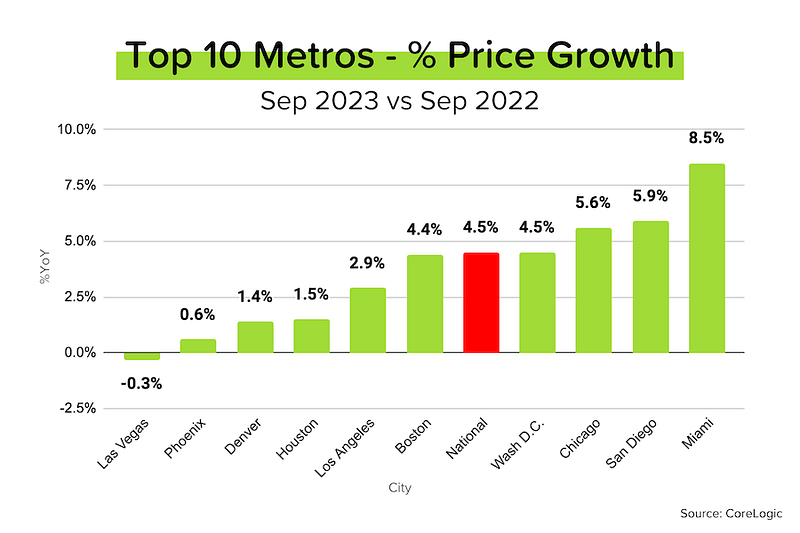
Black Knight: Prices +0.4% MoM in Sep. The good news (for owners): mortgage-holder home equity is now within 2% of last year’s record highs at $16.4 trillion — $10.6T of which is “tappable.” The bad news (for buyers): monthly principal + interest payments now run over $2500 for the median-priced home. [Black Knight]
Harder to get a loan. The October Senior Loan Officer Opinion Survey from the Federal Reserve reported tighter bank lending standards across the board (commercial, industrial, mortgage.) Why are banks less likely to lend? A less favorable economic outlook, increased risk aversion, and deteriorating credit quality.
Home prices rose in 82% of metros in the 3Q, according to the NAR. The median increase was 2.2% YoY (3Q 2023 vs. 3Q 2022), with 25 (out of 221) metros experiencing price growth of more than 10%. In Fond du Lac, Wisconsin, home prices were up nearly 19% YoY! [NAR]
Checking in on Inventory
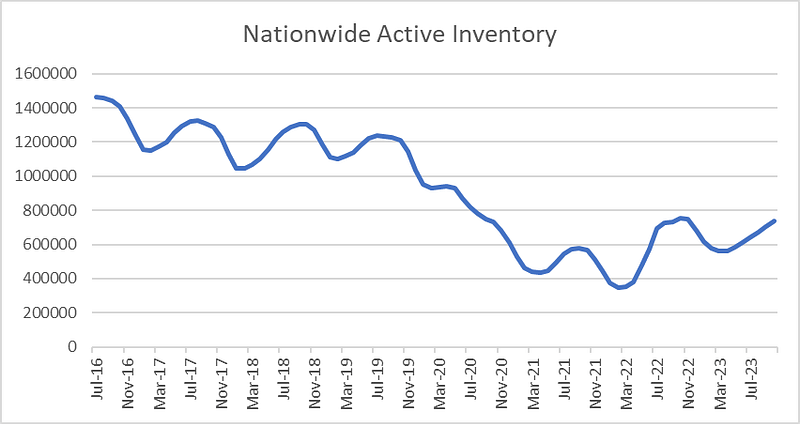
In a normal year, the number of homes available for sale (“active inventory”) would be dropping now. That’s because new listings typically peak in May or June, and then fall precipitously (who wants to sell a home in winter!?) In addition, many homeowners with a ‘stale’ listing may choose to take their property off the market in winter and relist it in the spring, thereby resetting the “Days on Market” back to 1.
But so far this fall/winter, active inventory has (abnormally) continued to rise! The number of new listings is falling (like normal), but it’s been declining at a slower pace. This, combined with a drop in sales volumes has allowed active inventory to keep rising right through October.
- Nationwide active inventory in October 2023 (737,000) is 30% above where it was in October 2021, but it’s still 39% below October 2019.
- That said, there are a number of large markets where active inventory is significantly higher than it was pre-pandemic: Austin-Round Rock TX (+18%), Colorado Springs CO (+9%), Lakeland FL (+8%), Memphis TN (+7%).
- And there are many markets where the decline in inventory has been much more pronounced: Hartford CT (-77%), Allentown PA (-69%), Providence RI (-65%), Chicago-Naperville IL (-72%), Syracuse NY (-62%).

Mortgage Market
How did we go from 8%+ mortgage rates to sub-7.5% in just a few days? To recap:
- The Fed’s second “skip”
- The weaker-than-expected job numbers (both ADP and BLS)
- Comments from big money managers that the bond market was ready for a reversal
- Slower GDP growth/contraction in Europe
As a result, the bond market is now convinced (again) that the Fed is: 1) effectively done with hiking rates, and 2) will need to start cutting rates next year. Based on analysis from the CME Group, the market is implying rate cuts of 50–100 bps in 2024.

They Said It
“Homeowners have accumulated sizable wealth, with a typical homeowner gaining more than $100,000 in overall net worth since 2019. However, the persistent lack of available homes on the market will make the dream of homeownership increasingly difficult for younger adults unless housing supply is significantly boosted.” — Lawrence Yun, NAR Chief Economist
“Given the continued rise of borrowing costs in 2023, it is remarkable to see how resilient home price growth has been in recent months, with September’s 0.3% month-over-month gain lining up with pre-pandemic trends. Nevertheless, as mortgage rates significantly impact affordability, certain markets with continued in-migration from more expensive states are showing renewed buoyancy and outsized monthly price gains.” — Selma Hepp, CoreLogic Chief Economist
Here’s your links for this weekend’s events!
My Website always has a list of what’s upcoming. Go here and maybe I’ll see you out there!
|
|
|
|
|
|
|
|
|
|
|
|
|
|
|
|
|
|
|
Get your Home Value, wealth Snapshot and Ideas what to do with your Equity Every Month!
Join DeDe’s Secret Private Facebook group for tips, tricks, discounts and Freebies!
DeDe’s Social Media: Click on picture to read/watch
What’s Going on with DeDe?
This week, the kids got a trip to doggy Disneyland with the world’s biggest doggy pool! They successfully supervised the refilling of a friend’s pool and had a blast!


Arizona Fall League is almost over. Last game Satureday. Check the schedule and maybe I’ll see you out there! Go Glendale Desert Dogs!


Celebrated the closing of a house purchase with wonderful clients and friends at Medieval Times! A blast was had by all!


That’s all for this week’s edition of the newsletter! Know I am always here for any questions you have about Buying, Selling, or Investing in Residential Real Estate! HomeOwnership too! Vendors and Tradespeople too! Don’t hesitate to Reach out
See you next Week!
DeDe


