
Fears of “higher for longer” interest rates helped send average 30-yr mortgage rates to a new, two-decade high of 7.49%. New home sales are holding up, but existing home sales have been fading on both affordability and availability issues.

The Phoenix Market
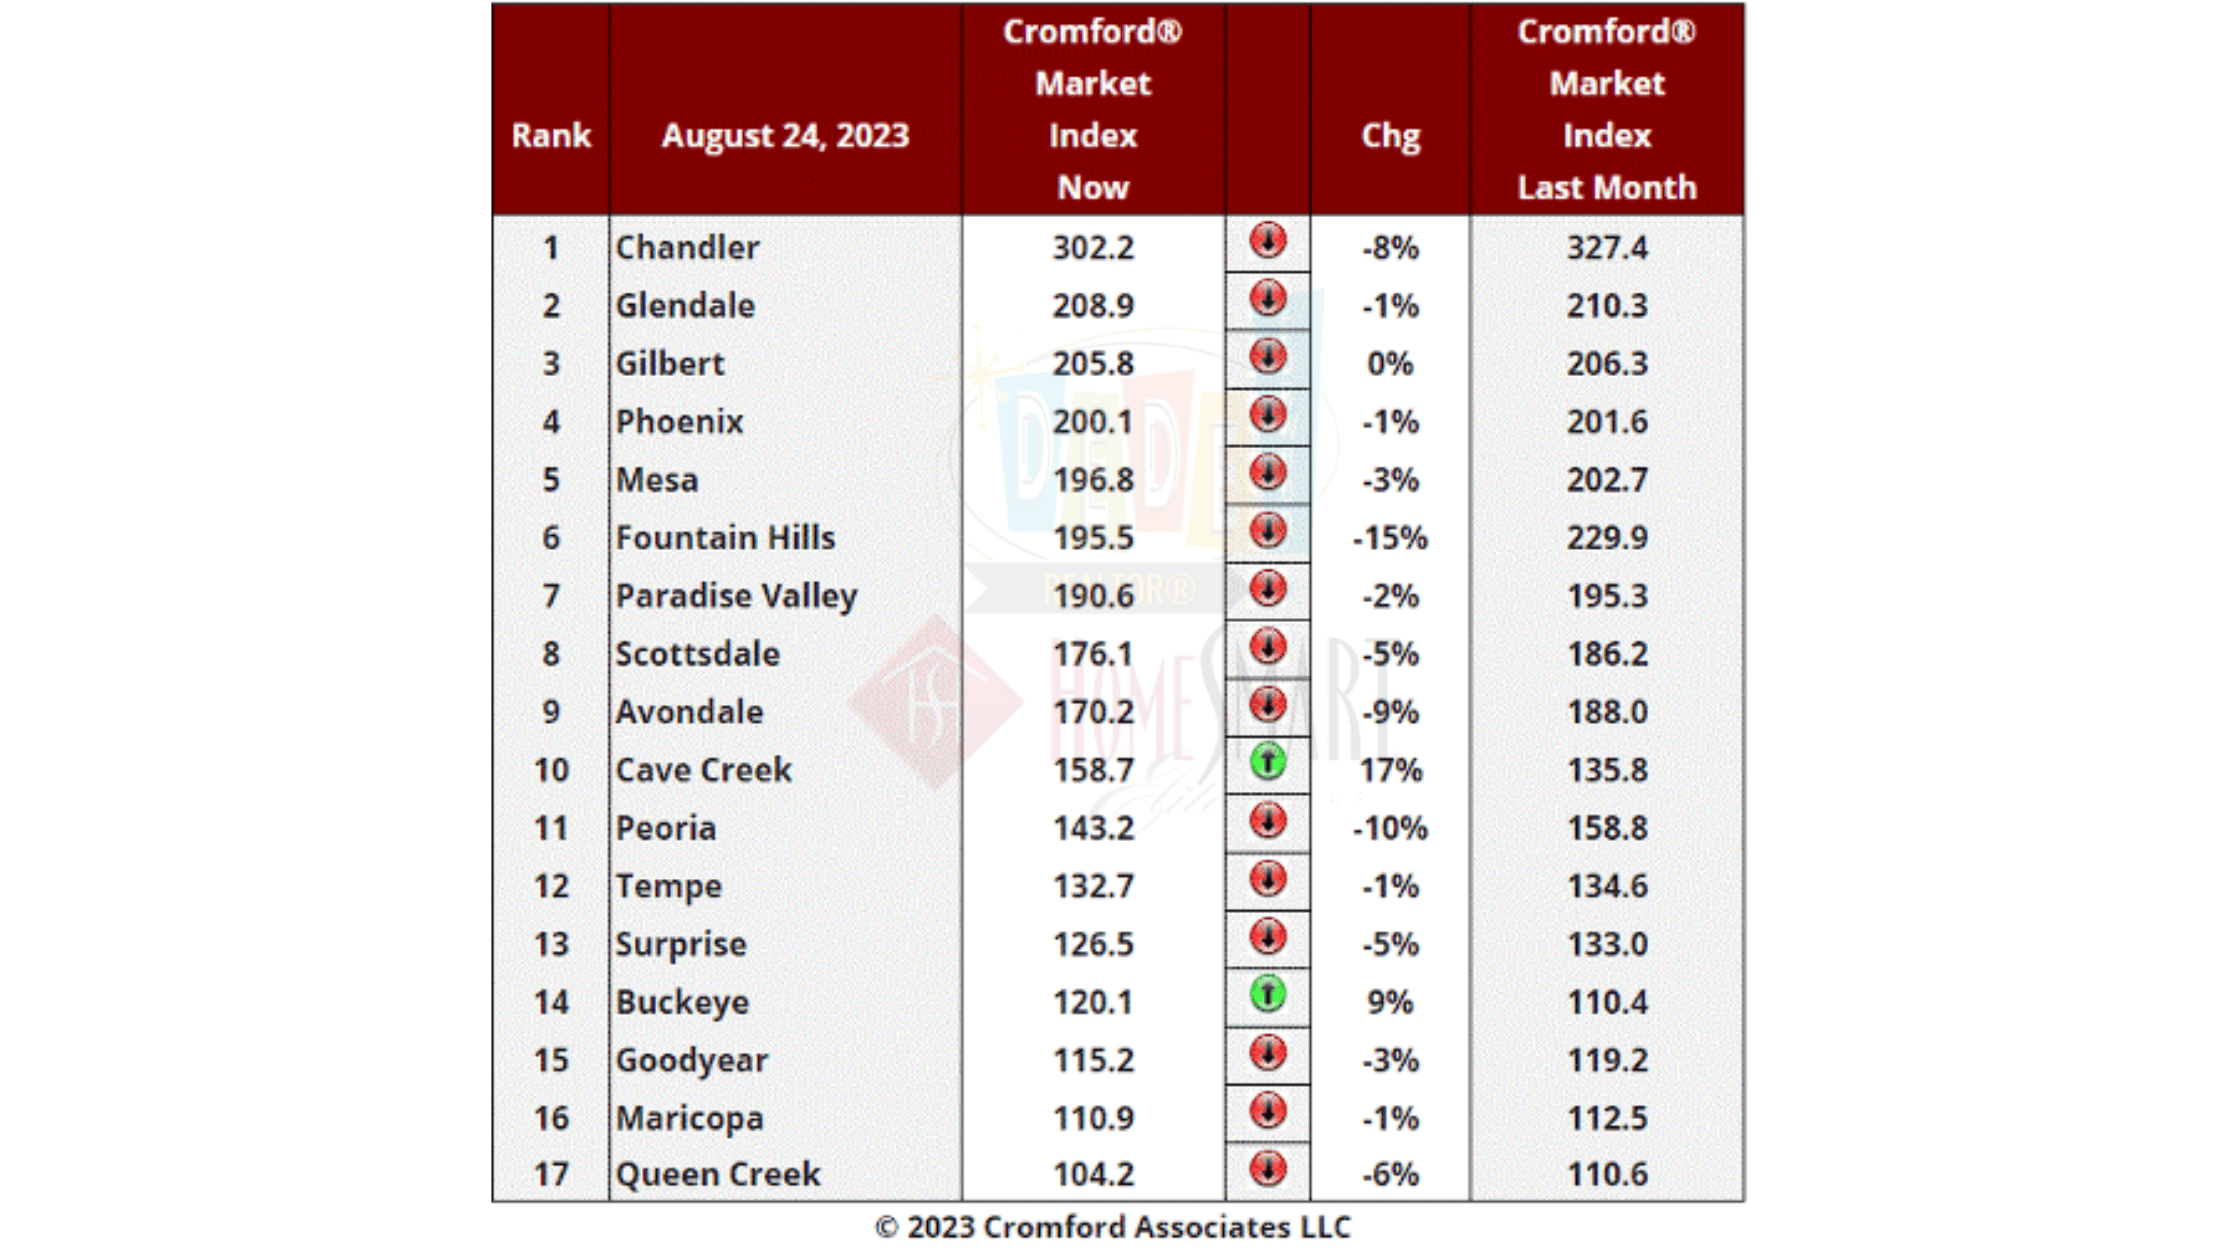
We’ve observed a decrease in the number of cities favoring sellers, with only 2 cities displaying such a trend now, as opposed to 3 last week. Notably, Gilbert has once again aligned itself with the seller’s side.
Despite this, the pace of the downward trend is showing signs of slowing down. The average change in the Composite Market Index (CMI) across these 17 cities over the past month has been -2.7%, which is less negative compared to the previous week’s measurement of -3.3%.
Buckeye continues to defy the overall trend and has successfully surpassed Goodyear as previously predicted. Additionally, Cave Creek is experiencing a robust recovery, having been among the first to decline several months ago.
Conversely, Fountain Hills, a once prominent leader and top contender, remains the most negatively impacted. Nevertheless, it maintains its status as a seller’s market with a CMI exceeding 190. Out of the 17 cities, 16 are still considered seller’s markets, while Queen Creek falls into the balanced zone.
Goldman Sachs
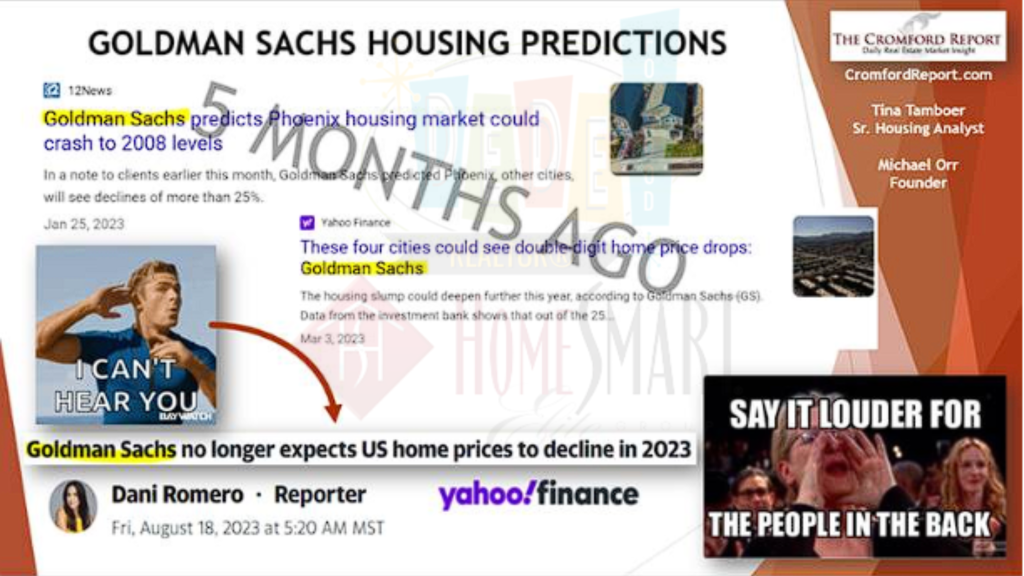
You might recall our observation from January 25th when we criticized Goldman Sachs for presenting “peculiar and improbable predictions.” Among these was their forecast suggesting a 25% drop in Phoenix home prices for the year 2023.
Interestingly, they have now openly acknowledged the inaccuracy of their earlier projections and have revised their stance. They have abandoned their previous anticipation of a decline in US home prices for 2023 and are now foreseeing a modest rise of 1.8% throughout the year.
To be bluntly honest, there’s scant evidence to support Goldman Sachs’ competence in gauging the dynamics of the US housing market. Perhaps this uncertainty is a contributing factor to their contemplation of selling their investment-advisory division.
Concise Market Snapshot
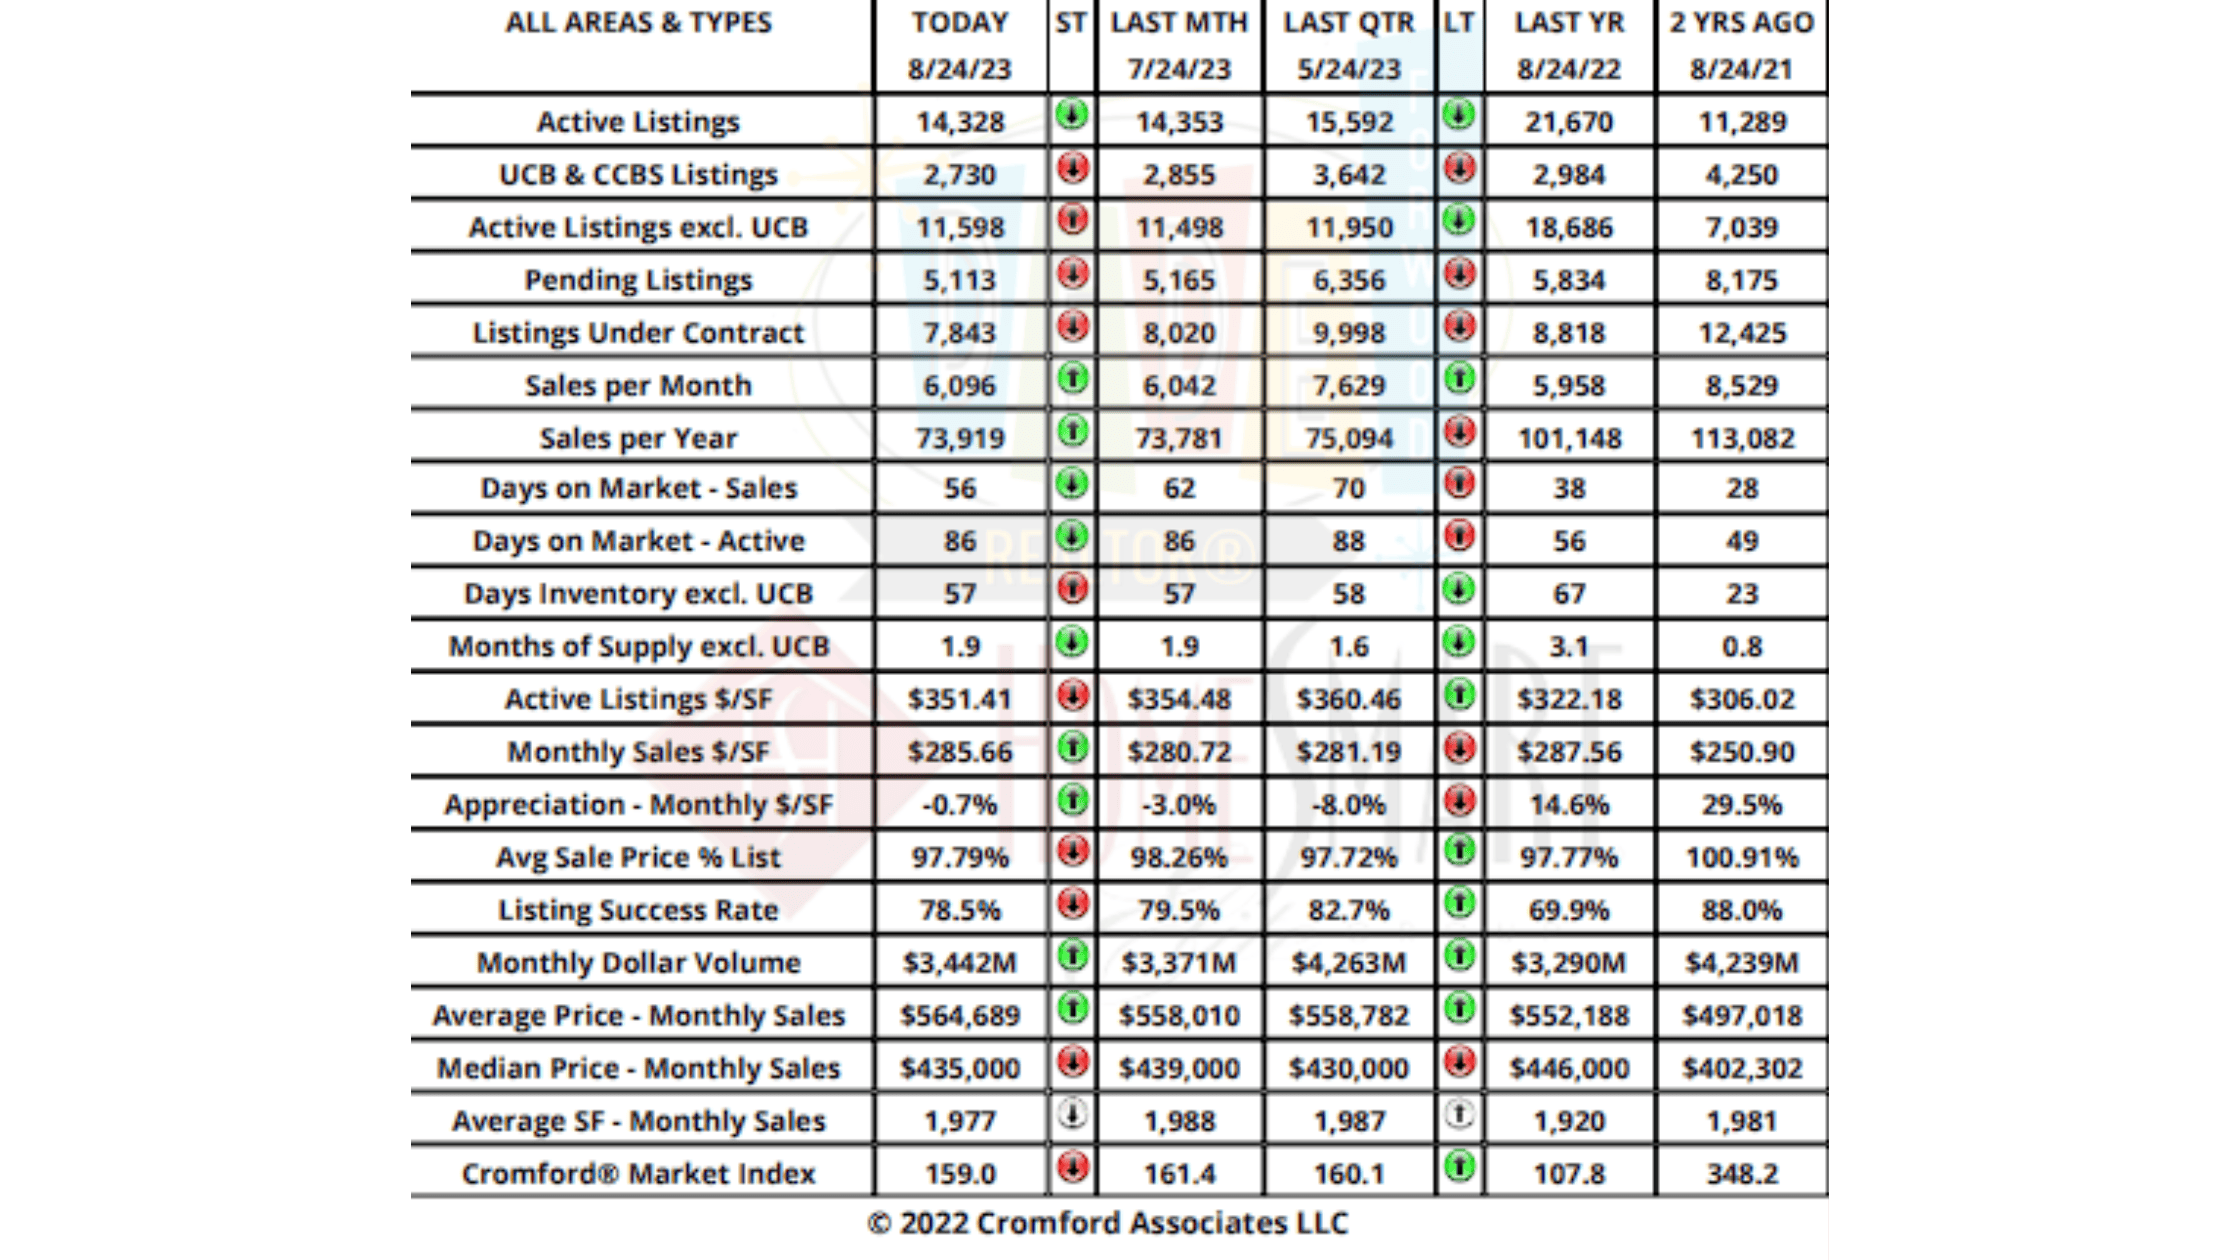
Active listings are very slightly down, as are Under contract and pending listings. Sales per month are slightly up as are sales per year. Days on Market is down (yay), days of inventory is the same, as is months of supply (1.9). Active listings $/sf is down slightly, but monthly sales $/sf is up. Appreciation is up (yay!).
[market_stats title=”Valley of the Sun Residental Inventory” type=”inventory” display=”ActiveListings,NewListings” property_type=”A”]
[market_stats title=”Valley of the Sun Residental Resale Prices” type=”price” display=”ActiveAverageListPrice,NewAverageListPrice,ActiveMedianListPrice,NewMedianListPrice” property_type=”A”]
[market_stats title=”Valley of the Sun Days on Market” type=”dom” display=”AverageCdom” property_type=”A”]
[idx_search title=”Search for homes here!” link=”1lnpxhkzmf4o” detailed_search=”on” destination=”local” user_sorting=”on” location_search=”on” property_type_enabled=”on” orientation=”horizontal” title_font=”default” field_font=”default” border_style=”squared” widget_drop_shadow=”on” background_color=”#10b0ca” title_text_color=”#000000″ field_text_color=”#000000″ detailed_search_text_color=”#000000″ submit_button_shine=”shine” submit_button_background=”#000000″ submit_button_text_color=”#FFFFFF” allow_sold_searching=”off” default_view=”list” listings_per_page=”10″ allow_pending_searching=”on”]
Real Estate News in Brief
It was a rough week for would-be buyers and real estate professionals: 30-yr mortgage rates approached 7.5%, existing home sales dropped to 4.07 million units SAAR, and new purchase mortgage applications fell to 1995 levels. But keep your head up, because Life Happens and Rates Happen too!
Average 30-year mortgage rates hit a new, two-decade high of 7.49% on August 22, surpassing the previous peak of 7.37% on October 20, 2022. The last time rates were this high was April 2002! (And 21 years ago, median home prices were 60% lower than they are today.) [Mortgage News Daily / S&P Global Case-Shiller Index]
Higher rates hit mortgage demand. According to the Mortgage Bankers Association, the number of applications for new purchase mortgages last week fell 7% week-over-week, and 30% year-over-year. That’s bad enough, but it’s also the lowest level of new purchase applications since 1995.
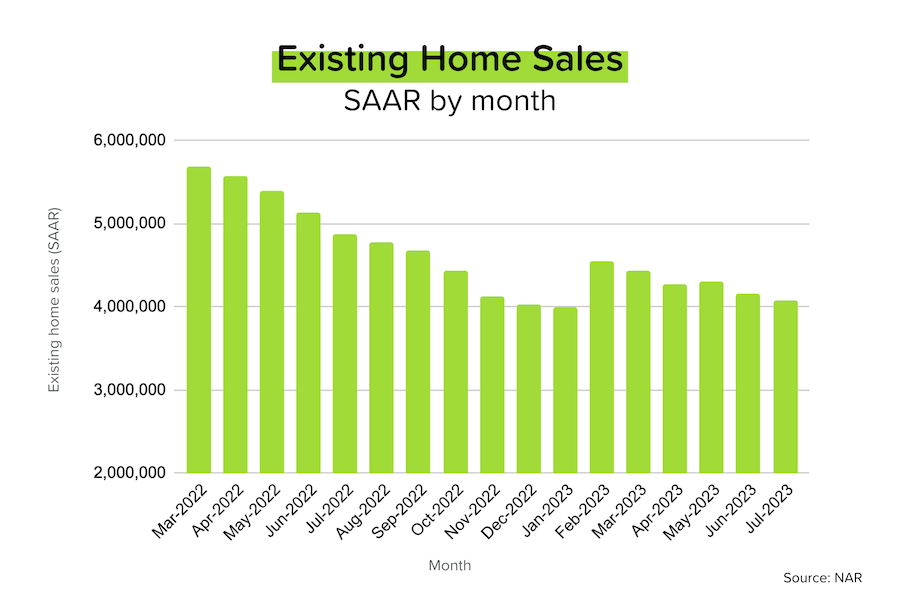
July existing home sales fell 2.2% MoM (and 17% YoY) to a seasonally-adjusted, annualized rate of 4.07 million units. That was both below expectations, and very similar to the (weak) figures achieved in December 2022 (4.03 million) and January 2023 (4.00 million). As a reminder, the last time we had annual existing home sales of ~4 million was 2008. [NAR]
The median sales price for existing homes in July rose 0.7% YoY to $406,700. While that was down 0.8% MoM, price declines are pretty normal for this time of year. Inventory rose 3.7% MoM to 1.11 million 🙂, but a large share of that were homes that have already gone under contract 🙁. [NAR]
In contrast, July new home sales rose 4.4% MoM (and 32% YoY) to a seasonally-adjusted, annualized rate of 714,000 units — the highest figure in 17 months. It’s also the 8th-straight month that the 3-month moving average of new home sales has climbed. [Census Bureau] A lack of existing home inventory is sending would-be buyers to show homes, and the greater financial flexibility of builders (rate buydowns, incentives) is helping to close the deal.
The median sales price for new homes in July rose 5.1% MoM (but fell 8.7% YoY) to $436,700. That’s actually the first MoM increase since February 2023. However, this number is heavily influenced by the “mix” of homes sold. Over the last year, builders have been redrawing plans to market smaller/more affordable homes (skewing ASPs lower). But more recently, there has been a recovery in the West region ($$$$$) new home sales (skewing ASPs higher). [Census Bureau]
The Realtor’s Confidence Index for July was mixed: the outlook for buyer/seller traffic declined for the 3rd-straight month, but competition levels remained very high: 74% of homes sold in <1 month, 35% sold above the listing price and there was an average of 3 bids per home sold. [NAR]
Rental rates dropped for the 3rd-straight month. Rents are only down 1% YoY (vs. +25% over the last 4 years), but with supply (+27% YoY increase in multifamily units) and vacancy rates (6.3%) rising, it’s likely that rental rates will continue to drift lower over the remainder of 2023. Miami, FL came out as the “least affordable” rental market; Oklahoma City, OK as the “most affordable”. [Realtor.com]
Zillow revised up its home price growth forecast. The portal now expects +5.8% YoY median home price growth for 2023 (up from +5.5% YoY previously), and +6.5% price growth over the next 12 months (July 2023 to July 2024). “Tight inventory conditions continue to place upward pressure on home prices, despite persistent affordability challenges.” The portal sees existing home sales falling 17% YoY to 4.2 million units in 2023. [Zillow]
New vs. old. Consistent with comments from the National Association of Homebuilders, Redfin’s research team said that new homes currently represent 31% (nearly one-third) of available homes for sale. Pre-pandemic, that figure was ~17% in the second quarter. In El Paso, TX, newly built homes were 52% of inventory; in Honolulu, HI and San Diego, CA, just 3%. [Redfin]
Small-scale property investors are having a big impact. According to data from CoreLogic, investors purchased 27% of the homes sold in 2Q 2023 (up from 15–20% pre-pandemic). But we’re not talking about Blackrock, here. Small investors (3–9 properties), represented 47% of all investor purchases — the highest level seen since 2011. [CoreLogic]
Realtors are Losing Confidence; but Still a Seller’s Market!
The Realtor’s Confidence Index for July revealed a housing market that is slowing (in terms of transactions and outlook), but that remains very competitive for what’s available:
- Only 11% of respondents expect an increase in seller traffic over the next 3 months.
- Homes that sold in July were on the market for ~20 days (vs. 18 in June)
- 74% of the homes sold in July found a buyer in <1 month (was 76% in June).
- The average number of bids per home sold fell from 3.5 in June to (a still high) 3.0 in July. In July 2022, the figure was 2.8.
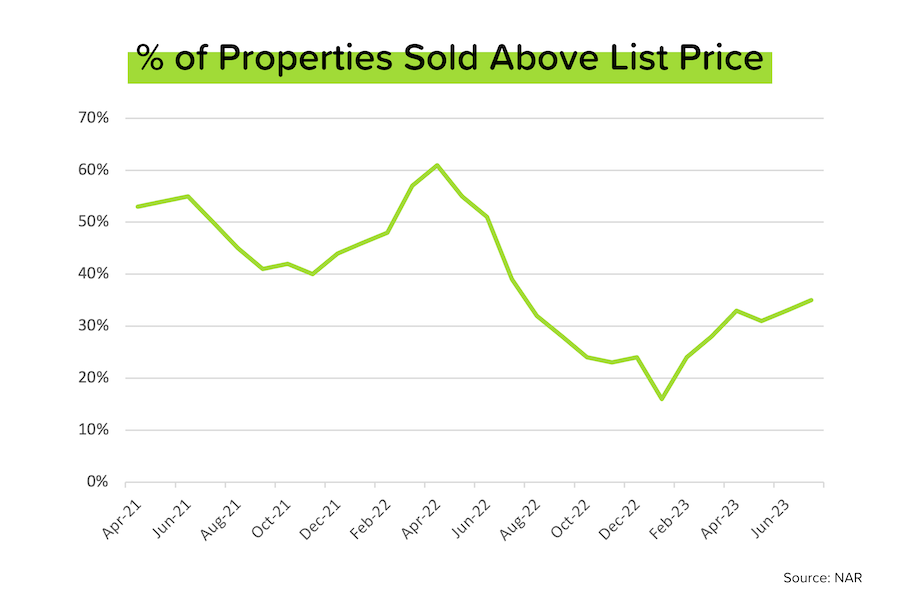
- And 35% of homes sold in July were transacted above the listing price (up from 33% in June) — see graph below. Keep in mind that the 40–60% figures for 2021 and early 2022 were unusually high.
- 26% of buyers waived the inspection contingency. That’s the highest figure since July 2022.
Mortgage Market
Last week, we did a ‘now and then’ comparison of Oct 22, 2022 (when average 30-yr rates peaked at 7.36%) and August 17, 2023 (when rates were threatening to make a new peak). The point we were making was that inflation had come down significantly during those 10 months.
This week, we’re comparing our new, two-decade high from August 22, 2023 (7.49%) with the last time rates were that high (April 2002). The most important difference is that in 2002, mortgage rates were actually on their way DOWN (from a high of 8.5–9.0%), in the wake of an aggressive Fed LOOSENING campaign as the Dotcom bust (March 2000-October 2002) rumbled on.

The situation is obviously very different today. The Fed is near the end of an aggressive TIGHTENING campaign, and the economy is chugging along despite a number of recession red flags flapping (inverted yield curve, negative leading indicators etc.).
Probably the most salient observation is that home prices have increased 2.5 times since the last time mortgage rates were this high. Affordability has been hit hard. The “reset” that the Fed was dreaming about has turned into a nightmare.
Fed Chairman Jerome Powell and global central bankers are meeting in Jackson Hole, WY this week. I’d expect more of the same, rehashed hawkish commentary from Powell on Friday. He would have nothing to gain from hinting that the tightening could be coming to a close. The next Fed meeting is on September 20, with the market currently pricing in an 80% probability of no change and a 20% probability of another 25bps hike.

They Said It
“Applications for home purchase mortgages dropped to their lowest level since April 1995, as homebuyers withdrew from the market due to the elevated rate environment and the erosion of purchasing power. Low housing supply is also keeping home prices high in many markets, adding to the affordability hurdles buyers are facing.” — Joel Kan, MBA’s Deputy Chief Economist
“Two factors are driving current sales activity — inventory availability and mortgage rates. Unfortunately, both have been unfavorable to buyers.” — Lawrence Yun, NAR’s Chief Economist
DeDe’s Social Media This Week:
My Social Media is all about educating, informing and entertaining, so check out my social media and my you tube to always be informed. Have a content idea or a question for me? Reach out and I’ll cover it next time!


Just listed! Check this out West Valley Folks!
[idx_listing_details listing=”6597042″]
Here’s your links for this weekend’s events!

My Website always has a list of what’s upcoming. Go here and maybe I’ll see you out there!
Get your Home Value, wealth Snapshot and Ideas what to do with your Equity Every Month!

Join DeDe’s Secret Private Facebook group for tips, tricks, discounts and Freebies!

That’s all for this week! Get your downloadable copy of my newsletter here. Know I am always here for any questions you have about Buying, Selling, or Investing in Residential Real Estate! HomeOwnership too! Vendors and Tradespeople too! Don’t hesitate to Reach out
See you next Week!
DeDe