
Here’s the news, listings, open houses, events and more! Reach out if you have any specific questions! Enjoy!
Phoenix-Area Real Estate News
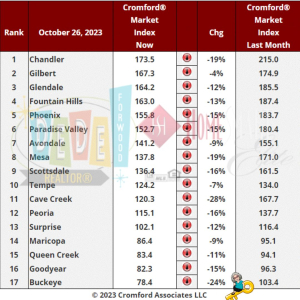
Here is our latest table of Cromford® Market Index values for the single-family markets in the 17 largest cities
The market is weakening at a faster rate, with an average decline of 14.5% in the Cromford® Market Index for the 17 cities above. This is worse than the 13.4% decline we saw last week.
Well above average declines in CMI can be seen in Cave Creek, Buckeye, Chandler and Mesa. Falling but at a lower speed are Gilbert, Avondale, Maricopa and Tempe.
12 out of 17 cities are still sellers markets with Surprise in the balanced zone while Buckeye, Goodyear, Queen Creek and Maricopa are all buyers’ markets. Buckeye has even slipped below the 80 level.
Average List Pirce per Sq Ft
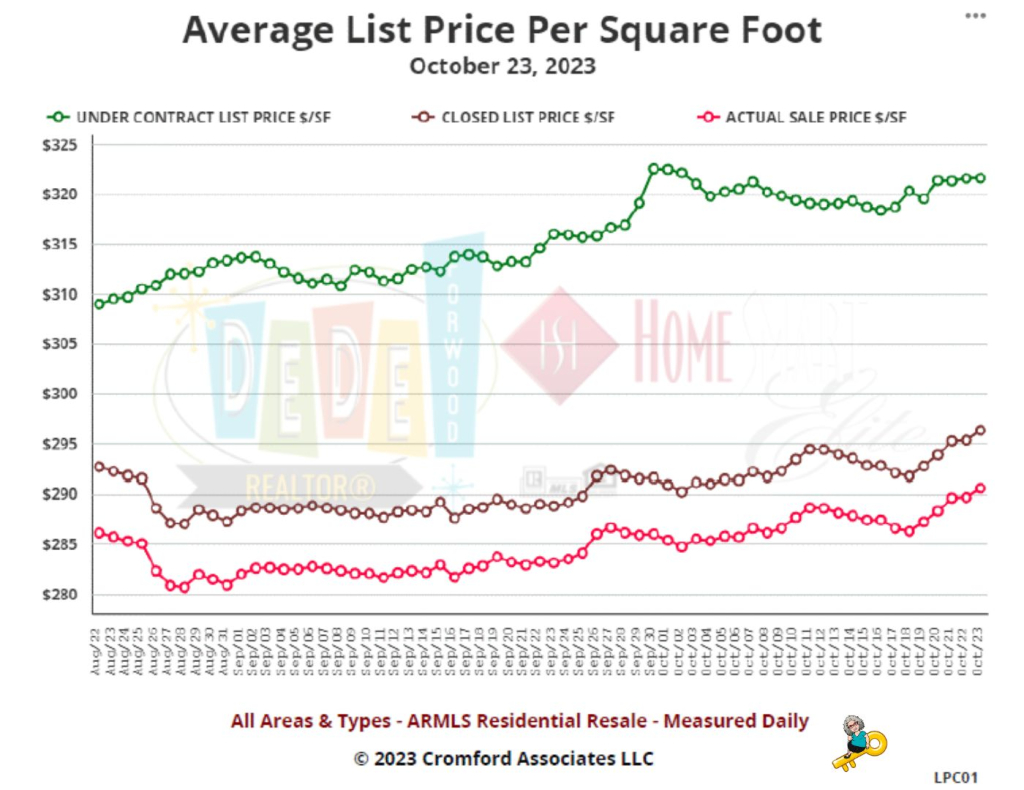
The monthly average sales price per sq. ft. has just breached $290 to the upside, while the average $/SF for listings under contract remains comfortably above $320.
As we see inventory rise we also see more sellers cutting their asking price, but this has not filtered through to the chart.
Concise Market Snapshot
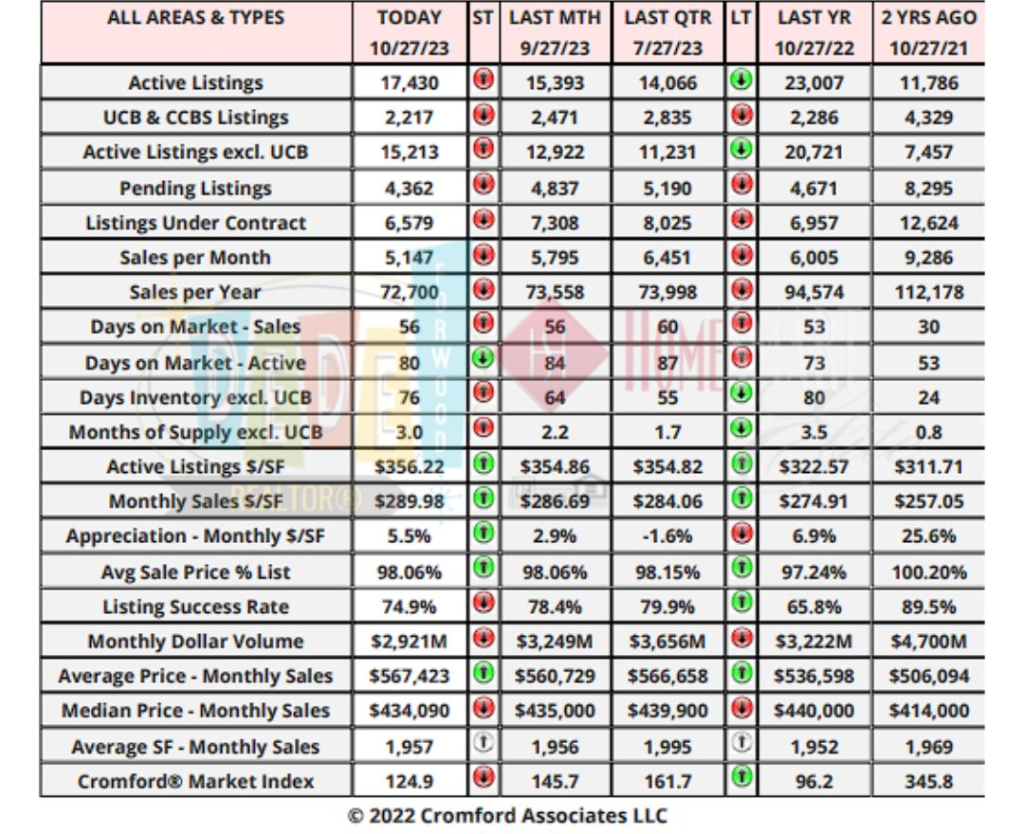
The table provides a concise statistical summary of today’s residential resale market in the Phoenix metropolitan area.
The figures shown are for the entire Arizona Regional area as defined by ARMLS. All residential resale transactions recorded by ARMLS are included. Geographically, this includes Maricopa county, the majority of Pinal county and a small part of Yavapai county. In addition, “out of area” listings recorded in ARMLS are included, although these constitute a very small percentage (typically less than 1%) of total sales and have very little effect on the statistics.
All dwelling types are included. For-sale-by-owner, auctions and other non-MLS transactions are not included. Land, commercial units, and multiple dwelling units are also excluded.
Most Popular Pet Costumes

“A person should always choose a costume which is in direct contrast to her own personality.” Lucy, “It’s the Great Pumpkin, Charlie Brown”. Which pet costume is your favorite? Hot Dog? Bat? Pumpkin? Witch?
BankRate Mortgage Rates:
For today, Saturday, October 28, 2023, the current average interest rate for a 30-year fixed mortgage is 8.04%, rising 1 basis point since the same time last week. If you’re in the market for a mortgage refinance, the national average 30-year refinance interest rate is 8.18%, up 4 basis points from a week ago. Meanwhile, today’s national 15-year fixed refinance interest rate is 7.61%, rising 2 basis points since the same time last week.
New Listings:
[idx_slideshow title=”New to the Market” link=”default” horizontal=”5″ vertical=”1″ auto_rotate=”5000″ source=”location” display=”new” sort=”recently_changed” destination=”local” send_to=”photo”]
Upcoming Open Houses:
Don’t forget to bring me!
[idx_slideshow title=”Open Houses this Weekend” link=”default” horizontal=”5″ vertical=”1″ auto_rotate=”5000″ source=”location” display=”open_houses” sort=”recently_changed” destination=”local” days=”3″ send_to=”photo”]
Recent Price Changes:
[idx_slideshow title=”Recent Price Changes” link=”1j1974m9yayv” horizontal=”5″ vertical=”1″ auto_rotate=”5000″ source=”location” display=”all” sort=”recently_changed” destination=”local” send_to=”photo”]
Featured Listings:
[idx_slideshow title=”Featured Listings” link=”1r3sw5k5196o” horizontal=”5″ vertical=”1″ auto_rotate=”5000″ source=”location” display=”all” sort=”recently_changed” destination=”local” send_to=”photo”]
[market_stats title=”Valley of the Sun Sold Listings” type=”inventory” display=”SoldListings” property_type=”A”]
[market_stats title=”Valley of the Sun Inventory” type=”inventory” display=”ActiveListings,NewListings” property_type=”A”]
[market_stats title=”Valley of the Sun New Listings” type=”inventory” display=”NewListings” property_type=”A”]
[market_stats title=”Valley of the Sun Pending Listings” type=”inventory” display=”PendedListings” property_type=”A”]
[market_stats title=”Valley of the Sun Absorption Rate” type=”absorption” property_type=”A”]
[market_stats title=”Valley of the Sun Sale to Original List Price Ratio” type=”ratio” display=”SaleToOriginalListPriceRatio” property_type=”A”]
[market_stats title=”Valley of the Sun Average Days on Market” type=”dom” display=”AverageCdom” property_type=”A”]
[market_stats title=”Valley of the Sun New Listings Volume” type=”volume” display=”NewListVolume” property_type=”A”]
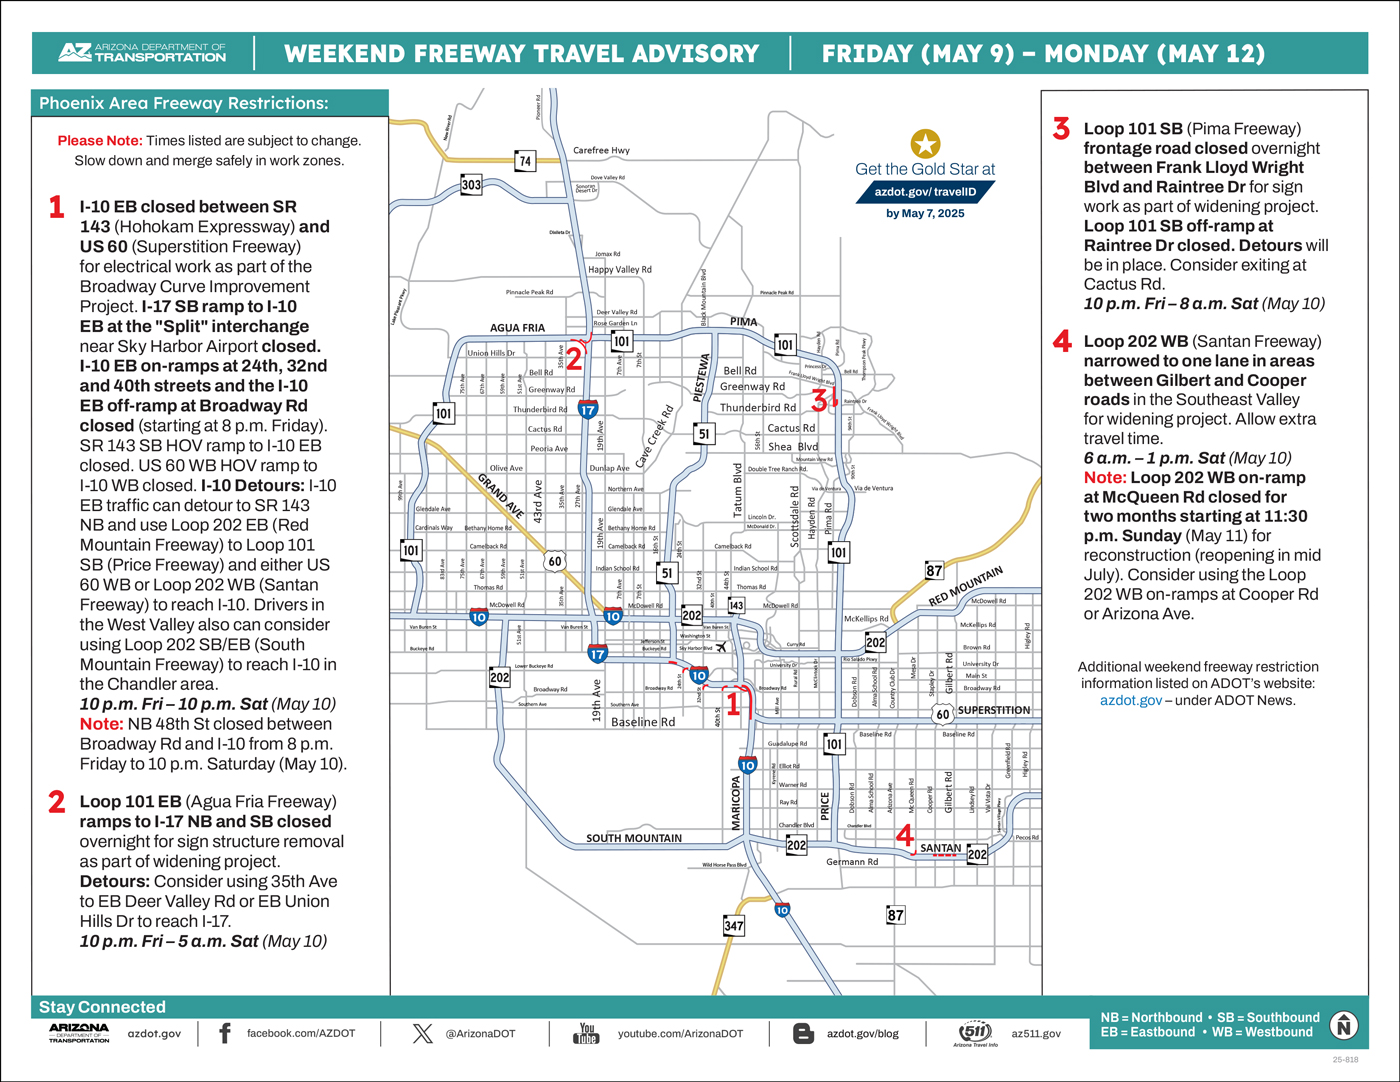
ADOT’s Weekend Freeway Travel Advisory (Oct. 27-30) – Phoenix Area
Lengthy closure of eastbound I-10 set near downtown, Sky Harbor area
PHOENIX – Improvement projects will require closures along two Phoenix-area freeways this weekend (Oct. 27-30), according to the Arizona Department of Transportation. Drivers should allow extra travel time and plan detour routes if necessary while the following weekend restrictions are in place:
- Eastbound Interstate 10 closed between the State Route 51 “Mini-Stack” and US 60 (Superstition Freeway) from 10 p.m. Friday to 4 a.m. Monday (Oct. 30) for work zone setup and lane adjustments as part of the Broadway Curve Improvement Project. All eastbound I-10 on-ramps between Third Street and Baseline Road closed, including the southbound SR 51 and westbound Loop 202 to eastbound I-10. Southbound I-17 connection to eastbound I-10 near Sky Harbor Airport closed. Southbound I-17 on-ramps at Seventh Avenue and Seventh Street closed.
- Detours: Eastbound I-10 drivers can consider using eastbound Loop 202 (Red Mountain Freeway) starting near SR 51 to reach southbound Loop 101 before using westbound US 60 or westbound Loop 202 (Santan Freeway) to reach I-10. Drivers in the West Valley also can consider using southbound/eastbound Loop 202 (South Mountain Freeway) to avoid the eastbound I-10 closure.
- Note: Following this weekend’s work the eastbound I-10 lanes will be divided (shifted) by a new work zone between 48th Street and Broadway Road (two lanes to the left and three lanes to the right of the work zone).
- Westbound US 60 (Superstition Freeway) closed between Power and Greenfield roads from 9 p.m. Friday to 5 a.m. Monday (Oct. 30) for bridge work. North- and southbound Loop 202 ramps to westbound US 60 closed. Westbound US 60 on-ramps at Ellsworth and Sossaman roads plus Superstition Springs Boulevard closed. Please allow extra travel time.
- Detours: Consider using either stretch of westbound Loop 202 (Red Mountain or Santan freeways). Drivers also can consider exiting ahead of the closure and using westbound Broadway Road, Southern Avenue or Baseline Road.
Schedules are subject to change due to inclement weather or other factors. ADOT plans and constructs new freeways, additional lanes and other improvements in the Phoenix area as part of the Regional Transportation Plan for the Maricopa County region. Most projects are funded in part by Proposition 400, a dedicated sales tax approved by Maricopa County voters in 2004.
Real-time highway conditions are available on ADOT’s Arizona Traveler Information site at az511.gov and by calling 511. Information about highway conditions also is available through ADOT’s Twitter feed, @ArizonaDOT.
National Real Estate News
Real Estate News in Brief How strong is underlying home demand? Despite average 30-year mortgage rates near 8% and record home prices, new home sales surged in September, pending existing home sales eked out a small increase, and first-time buyers were still around one-third of existing home purchases. If we could just get more inventory and lower rates, sales would skyrocket. HAPPY HALLOWEEN!
The US economy surprised. 3rd quarter US GDP rose 4.9% on an annualized basis. That’s the fastest rate of growth since 4Q 2021, and more than double the +2.1% posted the previous quarter. Consumer spending (which represents ~70% of GDP) and private fixed investment (~18% of GDP) drove the better-than-expected performance. Is near 5% growth sustainable? No. Does it make a recession look less likely? Yes.

Pending home sales edged higher. The NAR’s Pending Home Sales Index moved up +1.1% MoM from 71.4 in August to 72.6 in September. Considering what mortgage rates were doing in September, that’s an impressive feat. But let’s keep things in perspective: 72.6 is still near 20-year lows.
Central bankers are taking their foot off the brakes. The Bank of Canada kept rates unchanged at 5% for the second-straight meeting. The European Central Bank, meanwhile, held rates at 4%, ending 10 straight hikes. Both the US Federal Reserve and the Bank of England are expected to keep rates on hold next week.
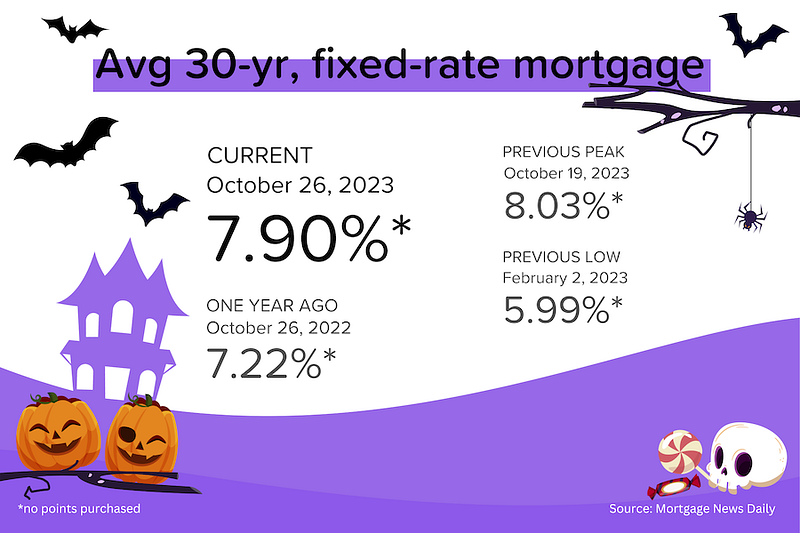
At least they’re not above 8% & 5%. When the yield on 10-year US Treasury bonds briefly hit 5% last week, they saw a surge in buying interest. The price of the bonds jumped, which (mathematically) pushed the yields down to 4.85%. Mortgage-backed securities had a similar move, which helped average 30-year mortgage rates move back into the high 7%s.
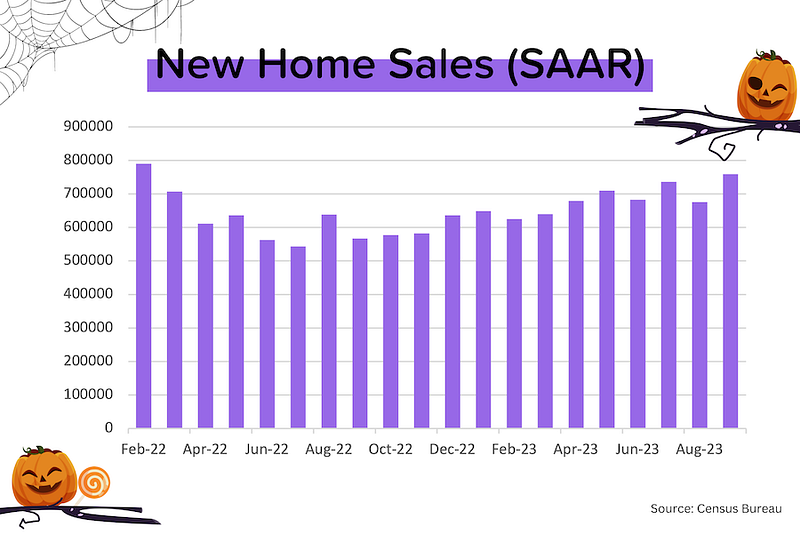
New home sales spiked. Sales of new homes in September leapt 12% higher MoM to an annualized pace of 759,000 units. That’s the biggest number we’ve seen since February 2022. How could this be possible with mortgage rates near 8%? Remember: 1) homebuilders can decide what they want to build (smaller units with lower prices,) and 2) homebuilders can choose to offer interest rate buydowns (and most are.)
Typical rental rates running below last year. According to Realtor.com, September rental rates were down year-over-year for the 5th-straight month. Here’s the frustrating thing: the Fed says that inflation is still too high, but the (very lagging) rental growth numbers that they are using in CPI and PCE are running at +7–8%!
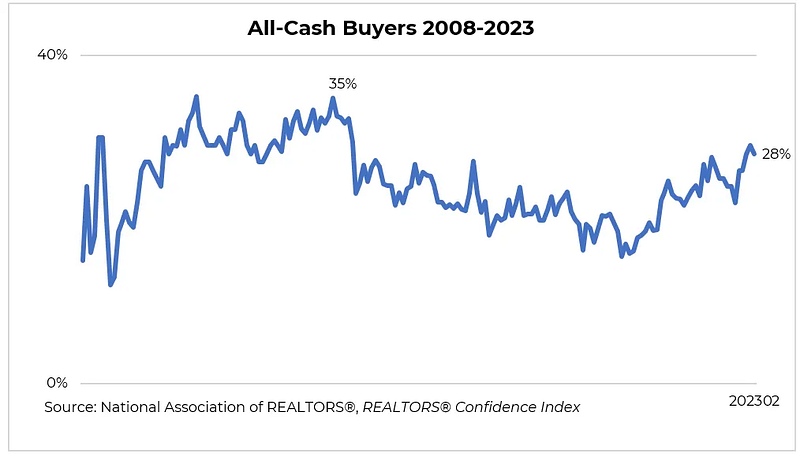
Cash is king (again)
In September 2023, 29% of successful buyers made all-cash (i.e., no mortgage) offers, the highest level since mid-2014. In fact, all-cash buyers have snagged >25% of home sales since January 2022. Over the last 15 years, the figure peaked at 35% in 2011, and bottomed at 12% in 2019. The main drivers of this % appear to be:
- Mortgage rates (duh!) — When rates are low, mortgage payments are easier to handle. When rates are high (like now), there’s significant financial benefit to paying all-cash if you can. [At an 8% mortgage rate, you will pay $656K in lifetime interest on a $400K loan!]
- Competition levels — Buyers (and their agents) prefer all-cash sales because they close faster and don’t have the same financing risk. In a multiple-bid environment (like we’ve been in for the last few years), the all-cash buyer often wins.
- Home prices / cheap deals — When home prices drop significantly, and/or when there are bank-owned properties for sale at bargain prices, the all-cash buyers swoop in.
- Crowding out — Remember, we’re talking about a percentage here. So if mortgage-backed buyers get scared off by high rates/high prices, while all-cash property investors or Baby Boomers stay active, that % rises.
Who are these all-cash buyers?
Should we blame mammoth asset managers like Blackrock and billionaire investment property buyers? Well, yes, especially in certain markets. But don’t forget about Grandpa and Grandma downsizing. Or the family from California that moved to Kansas. Or the newly-married couple who used a cash-backed offer from Orchard. There are more ‘normal’ people making all-cash offers than you think.
- Baby Boomers overtook Millennials as the biggest buyers in 2023, purchasing 39% of homes sold.
- They’ve got massive home equity (and wealth in general) as a group. As a result, 30–50% of the homes they buy are all-cash transactions.
- Combining the two statistics above, my back-of-the-envelope calculation suggests that Baby Boomers represent 65–75% of all-cash transactions.
- Foreign buyers often pay all-cash.
- Investment property buyers tend to conduct more all-cash transactions
- In response to the competitive frenzy, many new companies (Ribbon, Homeward etc.) sprouted up to provide all-cash offers to individuals who wanted to win but couldn’t come up with the cash themselves.

Where are these all-cash buyers buying?
During COVID, we wrote a lot about the “Pandexodus” — the migration of Americans from expensive, densely populated coastal cities, to cheaper locations nationwide. Until recently, you could sell your 2-bedroom apartment in San Francisco and buy a lakefront property in Idaho for all-cash. Over the last few years, interest in much more affordable Midwest and South region properties have soared, and cheaper home prices leads to more all-cash deals!
- All-cash deals were nearly 50% of sales in Cleveland, OH and Jacksonville, FL in late 2022
- At the same time, all-cash deals were less than 20% of sales in San Jose, CA and Seattle, WA
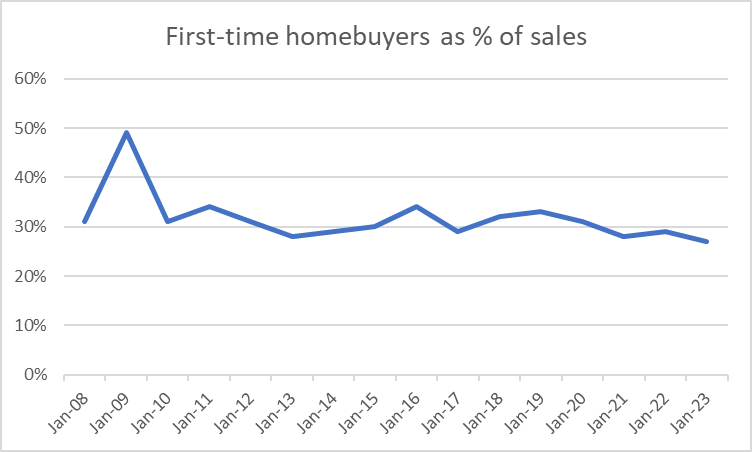
Just try and stop those first-timers!
You’d be forgiven for thinking that first-timers must have been forced out of the market by home prices hitting new records, mortgage rates approaching 8%, and the prevalence of all-cash offers. But no. According to the Realtors Confidence Index for September 2023, first-time buyers still represented 27% of total purchases.
It’s amazing how little the share of monthly sales going to first-time homebuyers has changed over time. As the graph below shows, the % has ranged from 26–49%, but the median is 31%. It basically doesn’t matter what home prices or mortgage rates are doing; first-timers are the buyers in one-third of the transactions!
Can you guess why? Here’s my take: while first-time home buyers should be the most price-sensitive (home prices + mortgage rates), they’re also the most motivated. When you get engaged or have your first child, it’s time to move out of your folks’ place (or that scruffy rental apartment) and become a homeowner. Life happens, and even in an unaffordable and unavailable market like this, you’ve got to bite the bullet.
Who are the first-timers?
No surprise here: they’re the younger generations. According to the NAR, “Seventy percent of Younger Millennials and 46 percent of Older Millennials were first-time home buyers. Behind these groups, 21 percent of Gen Xers were also first-time home buyers.”
Keep in mind that Millennials make up 22% of the US population. That’s over 72 million people who have recently reached or will soon reach the typical home buying age! Don’t believe that “Millennials are just going to live with their parents” baloney. They are already a huge part of existing home sales. And to the extent that Millennials and Gen Xers defer their home buying plans due to high prices/rates, massive demand will just keep building up.
And while first-timers are rarely all-cash buyers, it’s clearly too simplistic to see first-timers as the other side of the all-cash coin. From January 2021 to September 2023, the % of all-cash buyers rose from 19% to 29%. Over the same time period, the % of first-time buyers only fell from 33% to 27%.
Mortgage Market
The Fed Funds futures market is currently pricing in a 96% chance of NO rate hike and (how’s this for a change!) a 4% chance of a rate CUT on November 1! But it’s still putting a 24% probability of a +25 bps hike at the subsequent FOMC meeting on December 13. We’re definitely getting close to the end of this tightening cycle.
Let’s hope that peer pressure from global central bankers, plus encouraging inflation and jobs data next week, keeps the Fed on the sideline…until it’s time to start cutting rates. The ‘higher for longer’ bluster of some Fed members will vanish overnight if the economy starts to sputter.
Inspiration
As the US population (and household numbers) grows, it should be natural for existing home sales to grow as well. Household growth is the underlying driver of housing demand. Active inventory (the number of existing homes available for sale) plus new homes built is the supply.
Every year that we get fewer than 5.5 million in existing home sales is like compressing a spring. And that spring will eventually uncoil. New households are always being formed, and there are always reasons for people to move. The underlying need is there, you just can’t see it in transaction volumes because high mortgage rates have hit both affordability (demand) and availability (supply). You can see it, however, in the speed of sales (days on market) and competition levels (number of offers for each home sold).
Here’s your links for this weekend’s events!

My Website always has a list of what’s upcoming. Go here and maybe I’ll see you out there!
Get your Home Value, wealth Snapshot and Ideas what to do with your Equity Every Month!

Join DeDe’s Secret Private Facebook group for tips, tricks, discounts and Freebies!

DeDe’s Social Media: Click on picture to read/watch


What’s Going on with DeDe?
This week, the kids got a visit by their Grandmaw AND they got to have a slumber party with their Papa!


Brogan and I went to a beautiful wedding in a park followed by a wonderful backyard reception.

Had a wonderful Sunday Brunch at the Vig with friends

Got to a couple Arizona Fall League Games


Got to see one of my favorite bands, the Cult thanks to my friend Rob!


Darci has now had her lojack for 12 days. No escapes since then! She’s already in the top 15 of activity!


And got to do my FAVORITE thing…I handed over the keys to a beautiful home for a WONDERFUL Family! Next stop…Medieval Times to CELEBRATE! THANK YOU to Michael Chalker and First Integrity Title for making this a WONDERFUL experience for all!


That’s all for this week’s edition of the newsletter! Know I am always here for any questions you have about Buying, Selling, or Investing in Residential Real Estate! HomeOwnership too! Vendors and Tradespeople too! Don’t hesitate to Reach out
See you next Week!
DeDe