Hello, Hope your September is going well! Here’s the news, listings, open houses, events and more! Reach out if you have any specific questions! Enjoy!
Phoenix Area Real Estate News
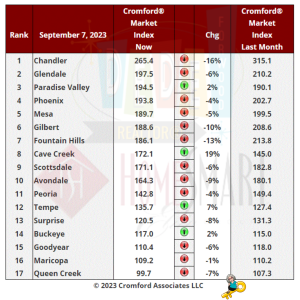
Once again this week, the same 4 cities that moved in a favorable to sellers direction, but the other 13 moved in a favorable to buyers direction. The downward trend accelerated since last week. The average CMI change in these 17 cities over the last month was -3.9%, more negative than last week when we measured -2.9%.
Buckeye is still moving higher but has lost momentum. Cave Creek is bouncing back hard, and is the fastest riser over the past month. Paradise Valley and Tempe are also looking relatively strong.
Most negative this week is Chandler, down 16%, though it remains comfortably ahead of the rest. Fountain Hills and Gilbert are also significantly weaker than this time last month.
15 out of 17 are sellers markets with Queen Creek and Maricopa in the balanced zone.
Among the secondary cities Casa Grande has slipped below 90 and is now classified as a buyer’s market. It is the only one so far. Among the rest of the secondary cities, Anthem, Apache Junction, Laveen, Sun Lakes and Tolleson are looking strong with CMI’s over 200. Only Laveen and Arizona City have seen an increase in their CMI over the past month, so the general trend is downward among these 12 cities too.
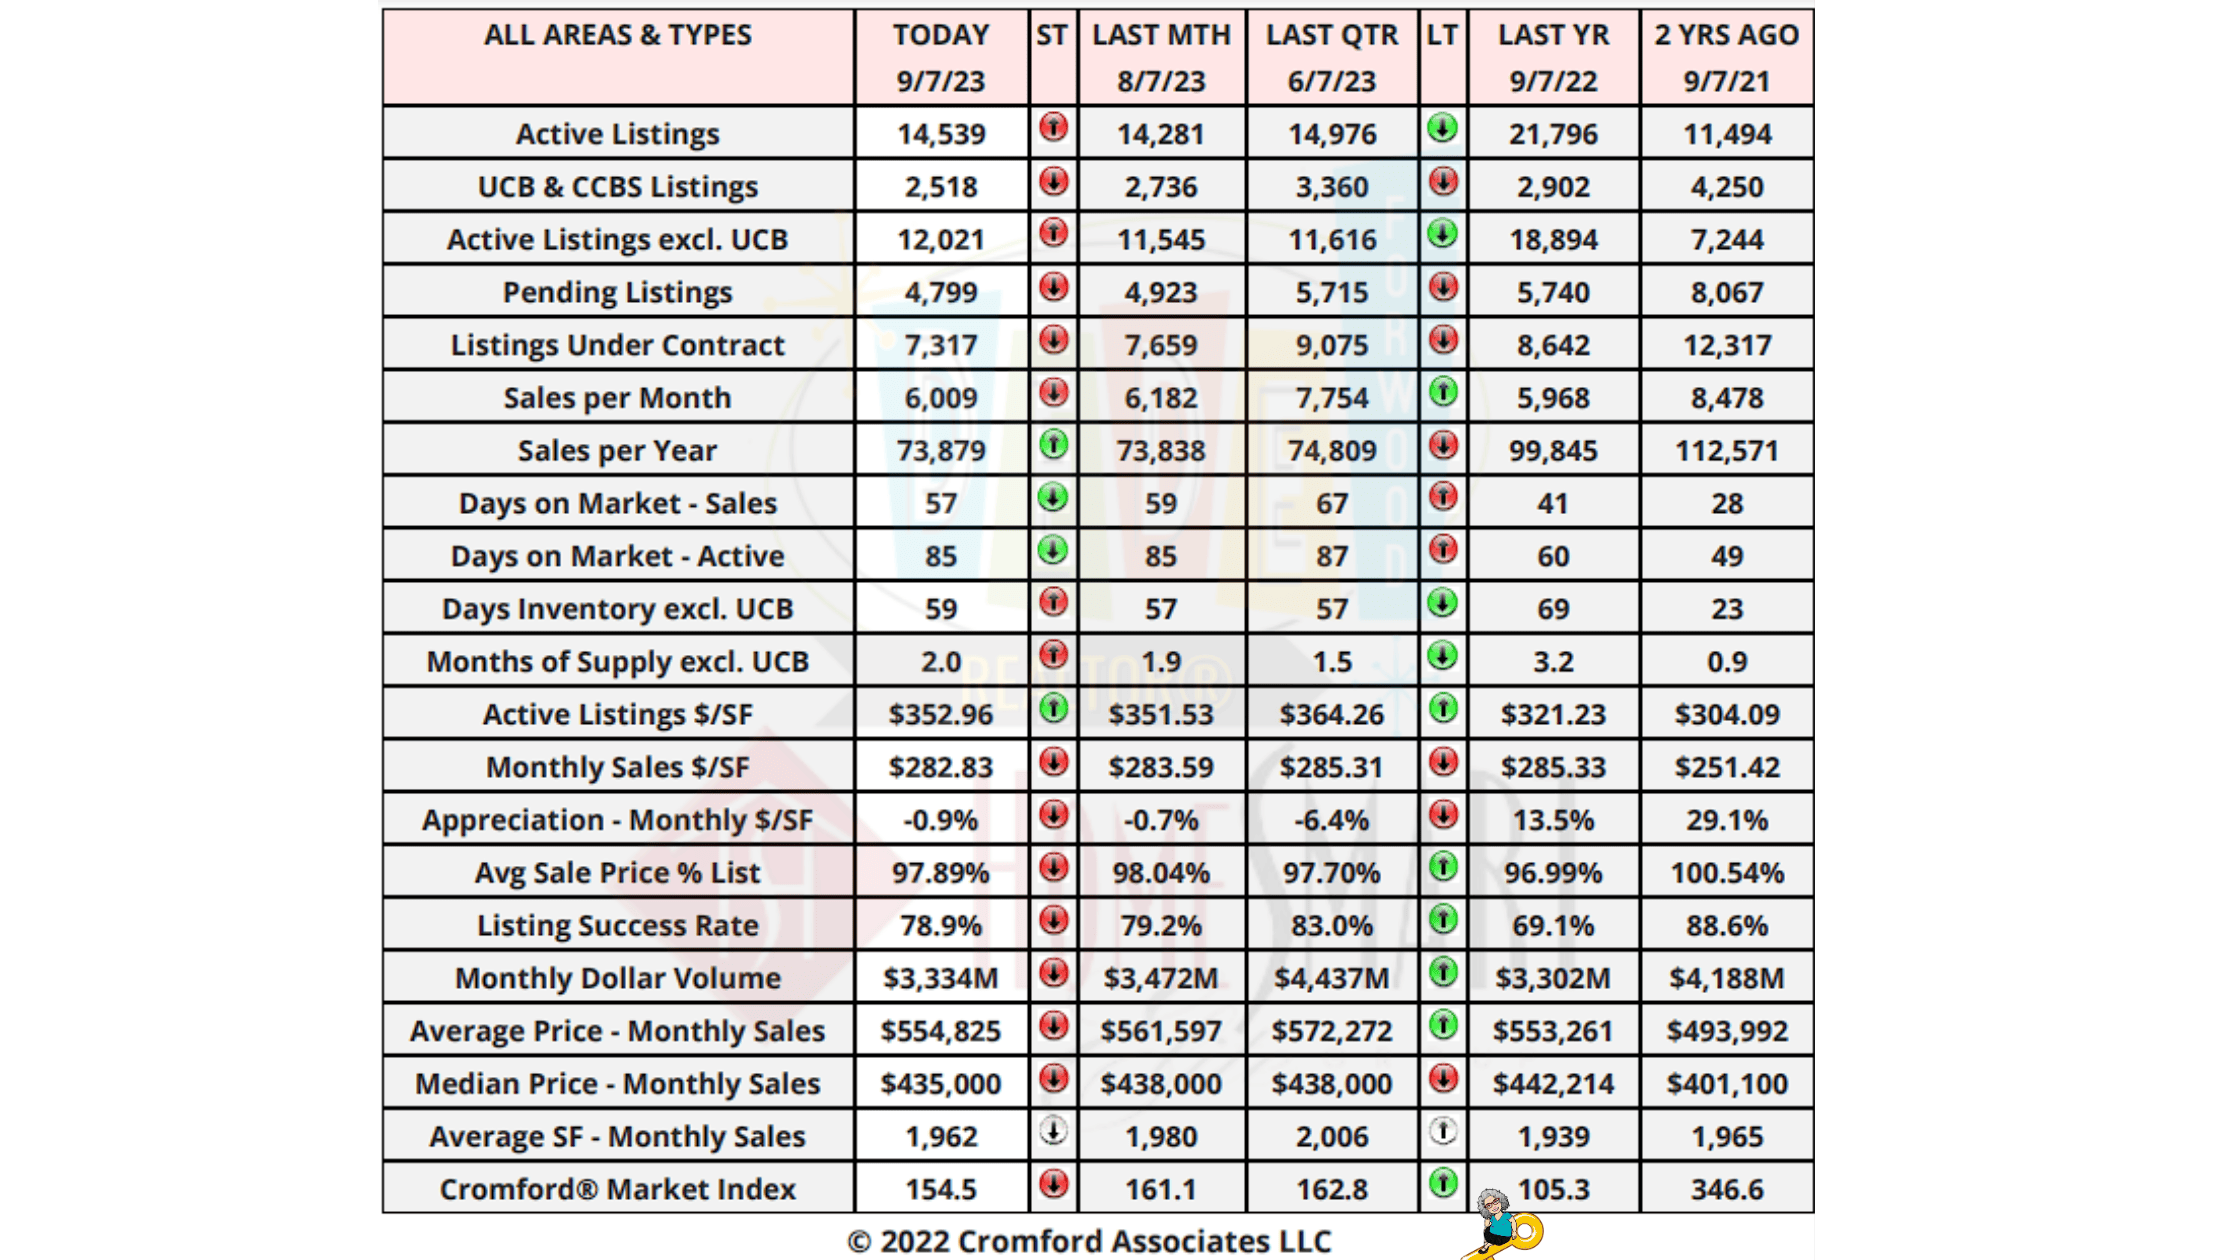

After failing to breach 165, the Cromford® Market Index has drifted slowly lower during July and August.However, the downward momentum has increase since mid-August and the advantage that sellers have had over buyers is beginning to disintegrate.
When the 30-year fixed mortgage rate stays above 7%, demand for re-sale homes is so feeble that it is not even enough to eat up the small number of new listings that appear each week. Available supply is starting to grow.
At 155, the CMI still has a long way to fall before we arrive at a balanced market around 110. However each day it moves lower strengthens the bargaining power of active buyers who are in a position to afford a home.
The Maricopa County affidavits of value filed during August have been analyzed and we found:
- there were 6,556 closed transactions, down 12% from August 2022 but up 8% from July 2023
- new home closings totaled 1,607, down 1.7% from August 2022 but up 19% from July 2023
- re-sale closings came in at 4,949, down 14% from August 2022 but up 4.7% from July 2023
- the median sales price was $459,076, down 1.6% from August 2022 and down 1.3% from July 2023
- the median sales price for new homes was $499,990, down 2.4% from August 2022 and down 6.3% from July 2023
- the median sales price for re-sale homes was $445,000, down 1.1% from August 2022 and unchanged from July 2023
[market_stats title=”Valley of the Sun Sold Listings” type=”inventory” display=”SoldListings” property_type=”A”]
Closings bounced back a little from July, but remain a long way below 2022 levels. The new home market continues to show more strength than the re-sale market, particularly in volume. However the new home sales mix moved sharply toward cheaper homes between July and August causing the median to drop dramatically by more than 6%, This was not caused by home builders lowering prices. It reflects smaller homes closing during August and fewer large luxury homes closing escrow. This is not an unusual occurrence for August but the scale of the change is larger than we usually see.
[market_stats title=”Valley of the Sun Inventory” type=”inventory” display=”ActiveListings,NewListings” property_type=”A”]
[market_stats title=”Valley of the Sun New Listings” type=”inventory” display=”NewListings” property_type=”A”]
[market_stats title=”Valley of the Sun Pending Listings” type=”inventory” display=”PendedListings” property_type=”A”]
[market_stats title=”Valley of the Sun Absorption Rate” type=”absorption” property_type=”A”]
[market_stats title=”Valley of the Sun Sale to Original List Price Ratio” type=”ratio” display=”SaleToOriginalListPriceRatio” property_type=”A”]
[market_stats title=”Valley of the Sun Average Days on Market” type=”dom” display=”AverageCdom” property_type=”A”]
[market_stats title=”Valley of the Sun New Listings Volume” type=”volume” display=”NewListVolume” property_type=”A”]
BankRate Mortgage Rates:
For today, Friday, September 08, 2023, the current average interest rate for the benchmark 30-year fixed mortgage is 7.55%, increasing 2 basis points over the last seven days. If you’re looking to refinance, the current average interest rate for a 30-year fixed refinance is 7.76%, up 10 basis points from a week ago. Meanwhile, the current average 15-year refinance interest rate is 6.89%, up 5 basis points compared to this time last week.
New Listings:
[idx_slideshow title=”New to the Market” link=”default” horizontal=”5″ vertical=”1″ auto_rotate=”5000″ source=”location” display=”new” sort=”recently_changed” destination=”local” send_to=”photo”]
Upcoming Open Houses:
[idx_slideshow title=”Open Houses this Weekend” link=”default” horizontal=”5″ vertical=”1″ auto_rotate=”5000″ source=”location” display=”open_houses” sort=”recently_changed” destination=”local” days=”3″ send_to=”photo”]
[idx_listing_summary title=”Featured Listings” default_view=”list” sort=”recently_changed” source=”location” agent=”20230117162014832506000000″ location_fields=”ListingId=6597042&6597042|ListingId=6584700&6584700|ListingId=6550235&6550235″ property_sub_type=”,” display=”all” widget_version=”2″]
ADOT’s Weekend Freeway Travel Advisory- Phoenix Area:
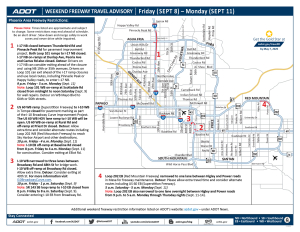
PHOENIX – Work on improvement projects will close or restrict some Phoenix-area freeways this weekend (Sept. 8-11), according to the Arizona Department of Transportation. Drivers should allow extra travel time and plan detour routes while the following weekend restrictions are in place:
- Northbound Interstate 17 closed between Thunderbird and Pinnacle Peak roads from 9 p.m. Friday to 5 a.m. Monday (Sept. 11) for pavement improvement project. Both Loop 101 ramps to northbound I-17 closed. Northbound I-17 on-ramps at Dunlap Avenue, Peoria Avenue and Cactus Road also closed.
- Detours: Drivers on northbound I-17 can consider exiting ahead of the closure and using northbound 19th or 35th avenues. Drivers on Loop 101 can exit ahead of the I-17 ramp closures and use local routes, including Pinnacle Peak or Happy Valley roads, to enter northbound I-17.
- Note: Westbound Loop 101 on-ramp at Scottsdale Road closed from midnight to noon Saturday (Sept. 9) for wall repairs. Detours include westbound Mayo Boulevard to 64th or 56th streets.
- Westbound US 60 ramp (Superstition Freeway) to westbound I-10 in Tempe closed from 10 p.m. Friday to 4 a.m. Monday (Sept. 11) for pavement marking as part of the I-10 Broadway Curve Improvement Project. The westbound US 60 HOV lane ramp to westbound I-10 will be open. Westbound US 60 on-ramp at Rural Road and off-ramp at Priest Drive closed.
- Detour: Allow extra travel time and consider alternate routes including westbound Loop 202 (Red Mountain Freeway) to reach Sky Harbor Airport and other destinations. For information about the project and other restrictions in the area please visit I10BroadwayCurve.com.
- Note: Eastbound I-10 off-ramp at Baseline Road closed from 8 p.m. Friday to 4 a.m. Monday (Sept. 11) for construction. Consider exiting at Elliot Road.
- Westbound I-10 narrowed to three lanes between Broadway Road and 48th Street from 10 p.m. Friday to 1 p.m. Saturday (Sept. 9) for bridge work. Westbound I-10 off-ramp at Broadway Road closed.
- Detour: Allow extra travel time. Consider exiting westbound I-10 at 40th Street.
- Note: Southbound SR 143 loop ramp to eastbound I-10 closed from 8 p.m. Friday to 8 a.m. Saturday (Sept. 9). Consider entering eastbound I-10 from Broadway Road. For more information please visit I10BroadwayCurve.com.
- Eastbound Loop 202 (Red Mountain Freeway) narrowed to one lane between Higley and Power roads in Mesa from 5 a.m. Saturday to 5 a.m. Monday (Sept. 11) for freeway maintenance.
- Detour: Please allow extra travel time and consider alternate routes including eastbound US 60 (Superstition Freeway).
- Note: Eastbound Loop 202 also narrowed to one lane overnight between Higley and Power roads from 9 p.m. to 5 a.m. Monday through Thursday nights (Sept. 11-14).
Schedules are subject to change due to inclement weather or other factors. ADOT plans and constructs new freeways, additional lanes and other improvements in the Phoenix area as part of the Regional Transportation Plan for the Maricopa County region. Most projects are funded in part by Proposition 400, a dedicated sales tax approved by Maricopa County voters in 2004.
Real-time highway conditions are available on ADOT’s Arizona Traveler Information site at az511.gov and by calling 511. Information about highway conditions also is available through ADOT’s Twitter feed, @ArizonaDOT.
National Real Estate News
It’s a highly unusual housing market, with prices hitting new records, but transaction activity at 2008–2010 levels, and mortgage rates back near 20-year highs.
Black Knight’s Home Price Index for July rose a stonking +1.5% MoM on a seasonally-adjusted basis. That was a big acceleration from the +0.7% MoM increase seen in both May and June. Annualizing the first seven months of HPI data suggests price growth of 7.5% for 2023. [Black Knight HPI]
It’s a PIty. The average monthly principal and interest payment (‘P+I’) for homebuyers financing with a 30-year loan in July 2023 was $2,306 (not excluding escrow payments). That’s the highest average P+I on record — and it’s likely to trend higher as both rates and home prices moved up in August. [Black Knight Mortgage Monitor]
Meanwhile, loan delinquency keeps falling. Over the last year, the % of loans in some stage of delinquency has dropped from 2.9% to 2.6% — basically at record lows. With massive home equity and low interest rates, existing homeowners are being punctual with payments. [CoreLogic]
The economy added 187,000 jobs in August, according to the Bureau of Labor Statistics. That was a bit better than expectations. However, the unemployment rate jumped from 3.5% to 3.8% — a very big move to happen in a month. And there were also big downward revisions to previous months. [BLS]
Oh, and Canada (the large country to our north) saw its 2Q GDP contract at an annualized rate of 0.2%. The market was expecting a positive figure of 1.2–1.5%. [Statistics Canada]
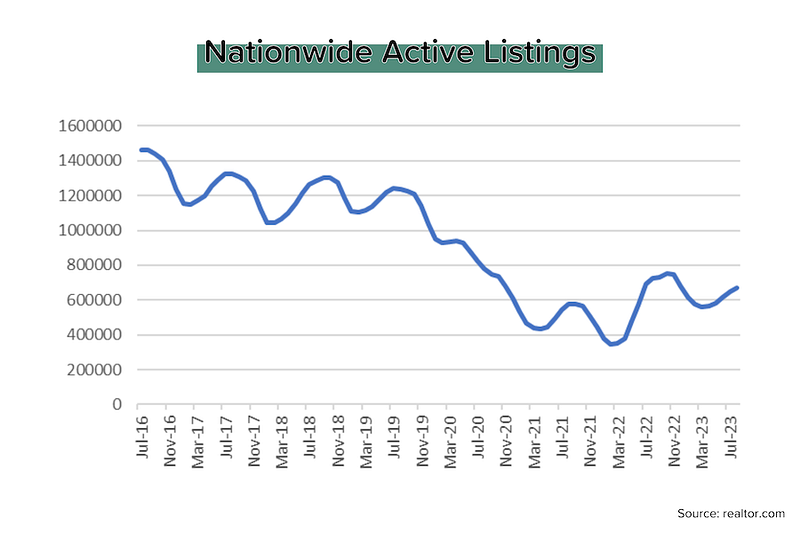
The nationwide ‘active’ inventory of homes for sale (excludes homes under contract) climbed 3.5% MoM in August to 669,173. New listings rose 3.5% MoM, which is unusual for August — they usually drop this month. So a smidgen of relief on the inventory side, but we’re still down 45–50% compared to pre-pandemic levels. [realtor.com]
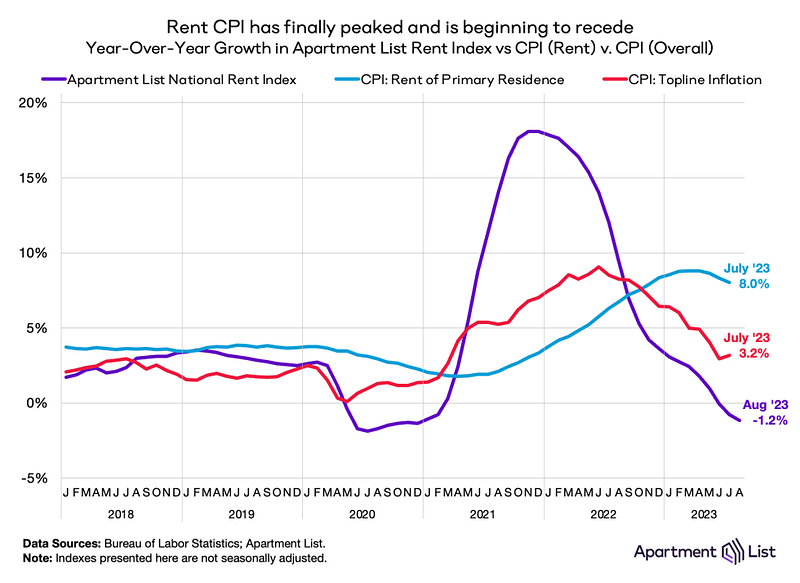
Zumper said that the national median rent for a 1-bdrm apartment was $1,510 in August, 1.6% higher than last year. That’s actually the smallest YoY increase in more than 2 years. Zumper, Apartment List and Zillow are all basically seeing the same thing: flattish rents. So why isn’t the Fed seeing it? More on this topic below. [Zumper]
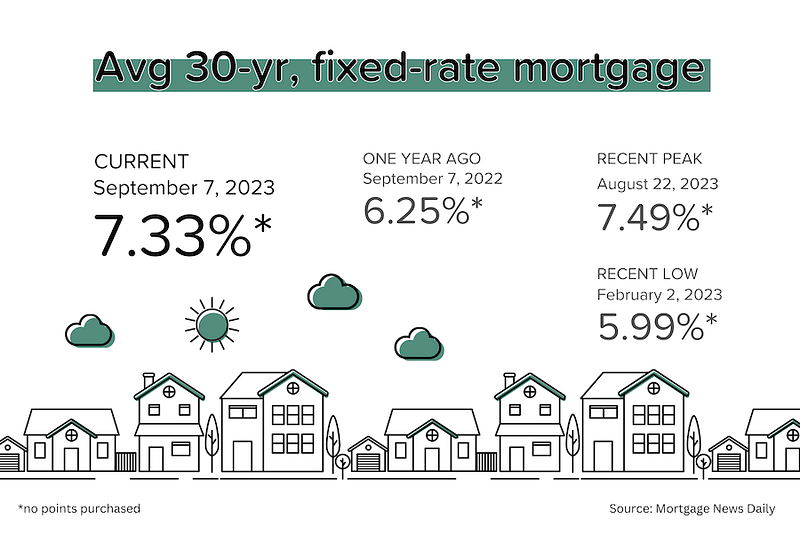
After dropping quickly last week from nearly 7.5% to almost 7.0%, average 30-yr mortgage rates reversed course and ended at 7.33% yesterday. [Mortgage News Daily]
Thoughts on existing home sales
We will finish 2023 with between 4.0 and 4.3 million existing homes sold. That will be a decrease of 14–20% compared to the 5.0 million sold in 2022, and a drop of 30–34% compared to the 6.1 million sold in 2021. It’s a disaster, right? Well, not really.
Bigger commission pool — The last time we sold 4.2 million homes was 2010. At that time, the median sales price was about $225,000. Today, it’s $416,000! Even if you assumed significant commission rate compression during that period, the total commission pool is up massively.
(I should note, however, that the number of Realtors grew ~40% over the last decade. So there are more people competing for that pool.)
“Stealing” from future sales — Coming out of the Great Recession, existing home sales bottomed at 4.1 million units in 2008, and then grew slowly, but steadily, to 5.5 million units in 2016. The pandemic-driven jump from 5.3 million to 5.6 million in 2020, and then to 6.1 million in 2021 should be viewed as “an outlier, not a benchmark” according to Mike Del Prete.
Consider this: the 5-year average for existing home sales was 5.4 million in 2019. That implies that we “stole” 0.2 million from future sales in 2020 (5.6 minus 5.4) and 0.7 million in 2021 (6.1 minus 5.4) or nearly 1 million in total. In 2022 we “gave back” 0.4 million (5.4 minus 5.0), and it looks like we’ll give back another 1.2 million (5.4 minus 4.2) in 2023E for a total of 1.6 million. At the end of this year, we’ll be “in the hole” about 0.6 million sales (1.6 minus 1.0).
We’re primed for a snapback. We just need a little help from lower mortgage rates to: 1) increase availability (fewer would-be sellers feeling ‘locked in’) and 2) increase affordability (lower monthly mortgage bills).


Know your rental rate vocabulary
Do you know the difference between asking rents, average rents and market rents? If you’re a property investor, you have to. But even if you’re not, it’s important to understand what you’re looking at when considering rental indices (like Apartment List or Zillow) or an inflation figure like CPI (which includes a big rental component).
Asking rent — Think of this as the listing price, but for a rental. It’s the rate the landlord is advertising. But that doesn’t mean that the landlord will actually get that rate. And it certainly doesn’t mean that every other unit in the apartment complex will pay that rate.
Average rent — Add up the current monthly rental rates for each of the units and divide by the number of units. Its simplicity is also its weakness.
In a multifamily unit, it’s rare for everyone to be paying the same rental rate. Some units will be bigger or smaller, renovated or original, have a nice view or no view. In a market with fast-rising rental rates, the guy who signed a 2-year lease back in early 2022 will be paying much less than the woman who just moved in…at least until his lease comes up for a renewal.
Market rent — When your landlord tells you that “I could easily rent this unit out for $1500/month”, he’s saying that the $800/month that you’re paying now is well below the market rent — for an apartment of this type, in this area. Your landlord probably won’t increase your rent by $700/month at the next renewal, but he’s certainly got that market rent in mind longer-term, and probably wouldn’t shed a tear if you decided to move elsewhere.
New rent — The contracted rate for the new lease. Could be lower than asking rent. Will probably be lower than the market rent if it’s a renewal.
Apartment List’s rent index (and most other public rental indices) measure the price change in new leases, as these “eventually trickle down to price changes across all leases (which is what the CPI measures).” Effectively, Apartment List is tracking the change in market/new rents, while CPI is tracking the change in average rents. In upswings and downswings, the market rent (purple line) will move much faster (and farther) than the average rent (light blue line).
Why is this important? Because the Fed is looking at the red line (“headline” inflation). But that red line would be much, much lower if it was using the purple line (instead of the light blue line) to measure ‘shelter’ cost inflation. Remember: shelter costs have a 35% weighting in headline inflation and a 43% weighting in “core” (ex-food & fuel) inflation!
Here’s what’s currently for rent on the ARMLS in the Valley of the Sun!
Mortgage Market
Last week it was happy days in the mortgage market, with average 30-yr rates plunging from 7.5% to near 7.0%. As a recap, that was because the jobs data (JOLTs, ADP and BLS) suggested a slowdown in the pace of hiring AND several Fed members made ‘I think we’ve done enough already’ comments.
This week, rates reversed course, rising back to 7.33% yesterday. Factors that influenced that included: 1) a strong ISM services number relative to consensus, and 2) huge corporate bond issuance. This DESPITE more Fed members making surprisingly dovish statements (like Loretta Mester below).
The next Fed meeting is on September 20. Despite the pull-back in bond prices, the market is still putting a 93% probability on NO HIKE.
They Said It
“We will certainly not continue to raise rates until inflation has already fallen to 2%. Nor will we wait to lower interest rates until inflation is at 2%.” — Loretta Mester, Cleveland Fed President
[Here’s what that comment means: ‘if we’re confident that inflation is coming down as a result of the cumulative impact of +525 bps in rate hikes, we don’t have to wait until we hit the target to stop hiking or even cut rates.’ This is actually a pretty dovish statement.]
“The worsening housing affordability crisis has an outsized impact on Gen Zers and millennials because they’re much less likely to own a home than older generations. That means many young Americans don’t benefit from rising home prices by gaining equity. Instead, these would-be first-time homebuyers bear the burden of high prices, high down payments and high monthly mortgage payments, without profits from a previous home to offset the cost. Many young people don’t have a choice between renting and buying. They’re renting their home because even though rent payments have increased, too, it’s still more affordable than buying in much of the country–and renters don’t need a down payment.” — Daryl Fairweather, Redfin Chief Economist.
DeDe’s Social Media this Week:
My Social Media is all about educating, informing and entertaining, so check out my social media and my you tube to always be informed. Have a content idea or a question for me? Reach out and I’ll cover it next time! https://linkin.bio/dedeforwood


Click on photos to read my Blog (I work really hard on it!)
Here’s your links for this weekend’s events!

My Website always has a list of what’s upcoming. Go here and maybe I’ll see you out there!
Get your Home Value, wealth Snapshot and Ideas what to do with your Equity Every Month!

Join DeDe’s Secret Private Facebook group for tips, tricks, discounts and Freebies!

What’s going on with DeDe this week?
I’ve been going pretty crazy with this decluttering. I’m downsizing…big time, so I’m having a GIANT YARD SALE on Saturday, September 9, 2023. Clothing, shoes, home decor, furniture, tools, home improvement items, and more! 8am-2pm. If you need something specific, reach out and I might have it! Come visit!
That’s all for this week! Know I am always here for any questions you have about Buying, Selling, or Investing in Residential Real Estate! HomeOwnership too! Vendors and Tradespeople too! Don’t hesitate to Reach out
See you next Week!
DeDe