
Here’s all the Phoenix-area and Nationwide Real Estate News! Have any specific questions? Don’t hesitate to reach out!

The Phoenix Market
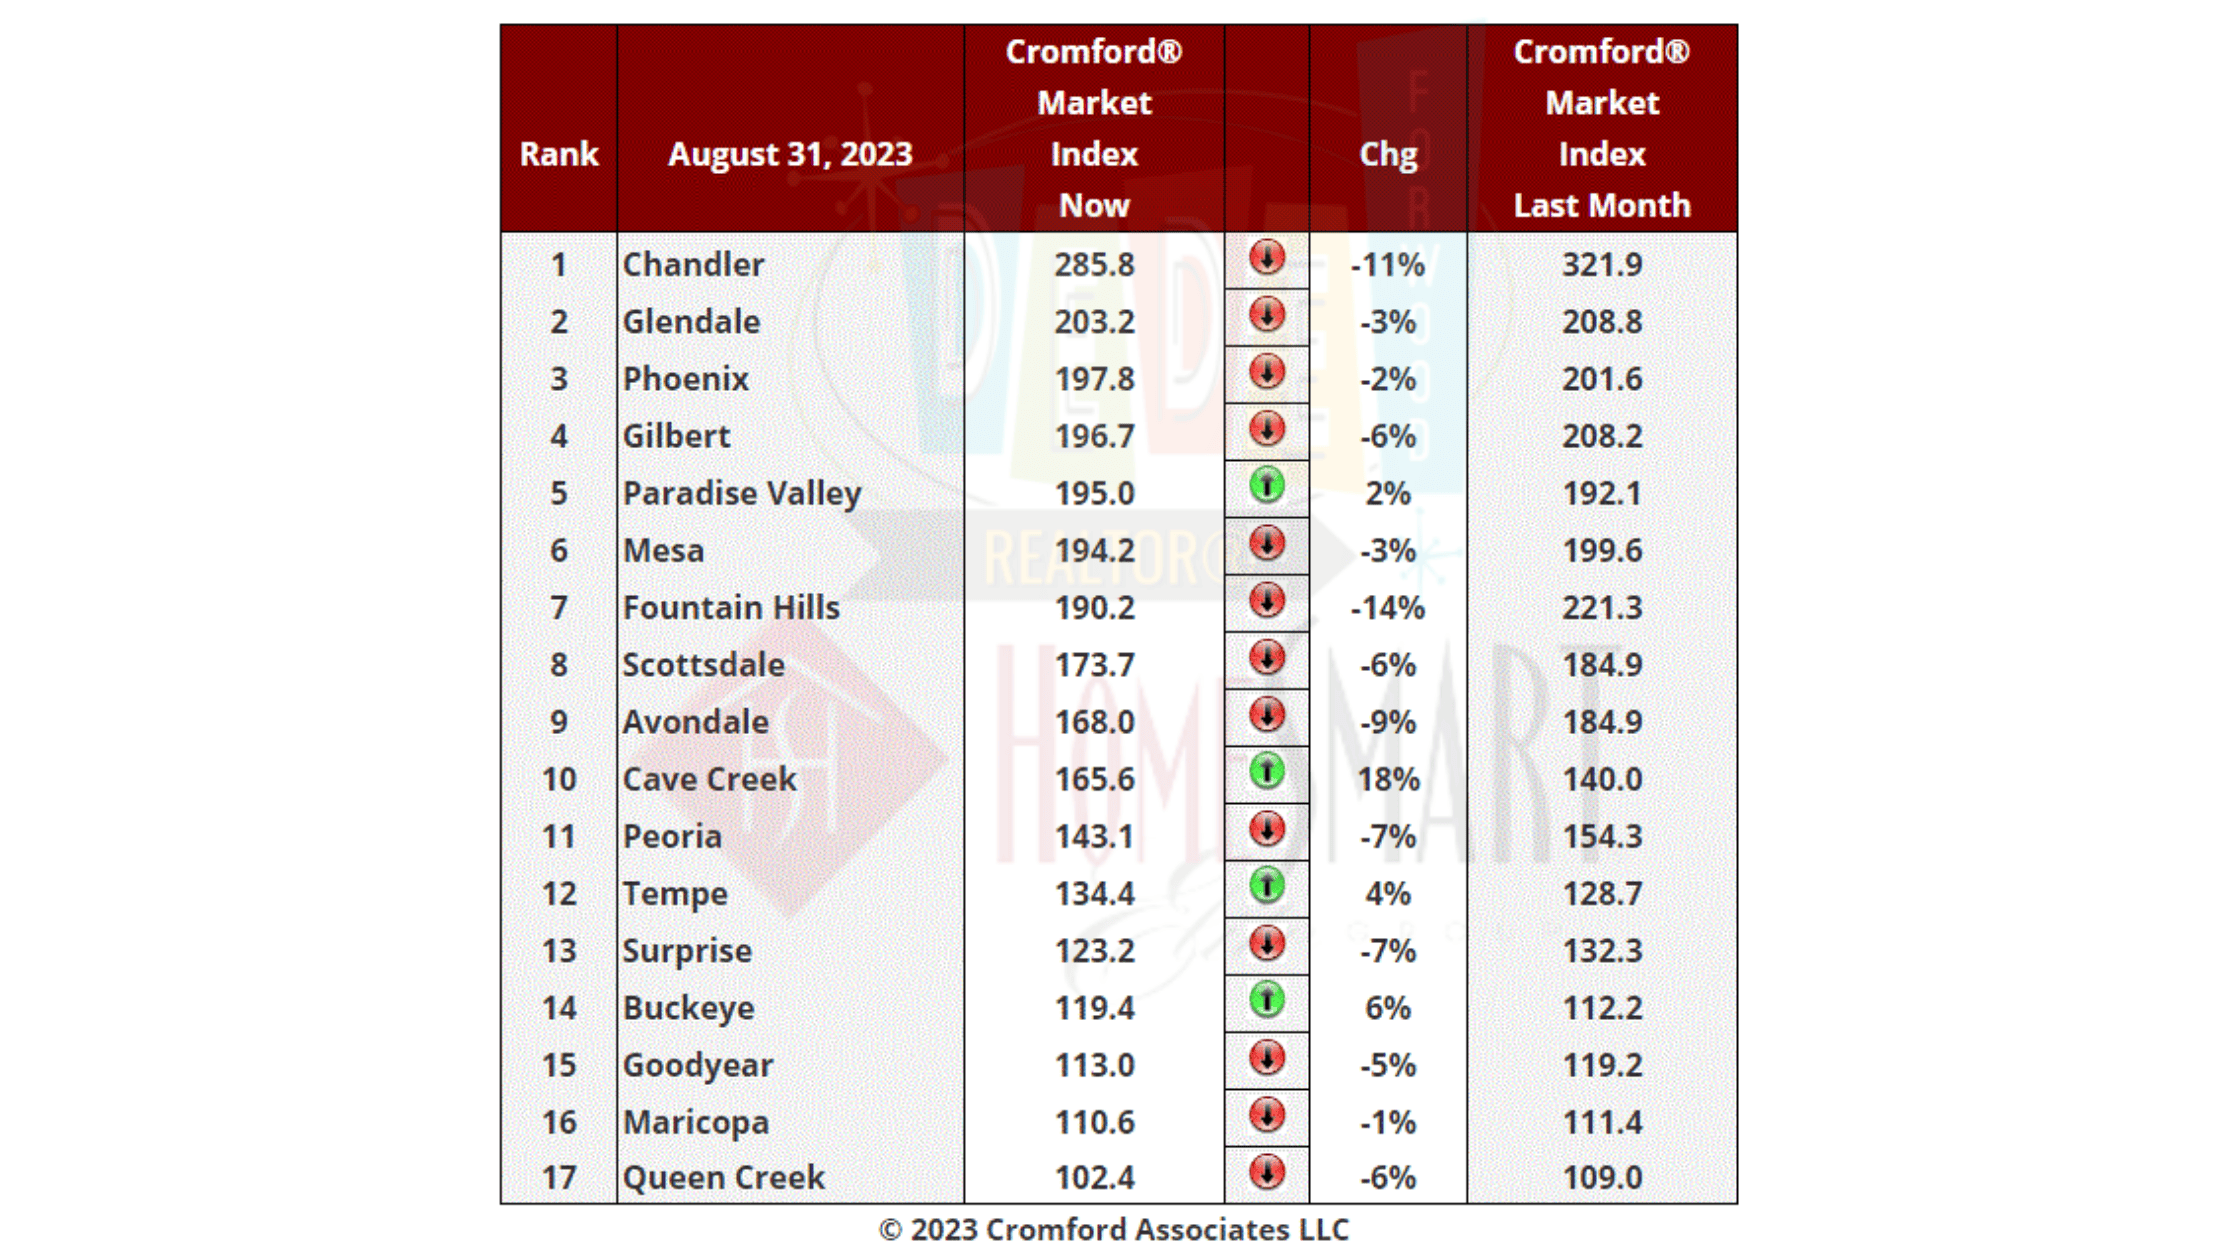
This week we have 4 cities that moved in a direction favorable to sellers, up from 2 last week. Paradise Valley and Tempe are the new members of the green team.
Even so, the trend downwards is slightly stronger than last week. The average CMI change in these 17 cities over the last month was -2.9%, more negative than last week when we measured -2.7%.
Buckeye is moving higher and has Surprise in its sights. Cave Creek is bouncing back hard, having been one of the earliest to decline several months ago.
Most negative again is Fountain Hills, a former number one. However it remains a seller’s market with a CMI over 190. 16 out of 17 are sellers markets with Queen Creek in the balanced zone.
Chandler is also declining fast although it remains out in front by a long way.
Concise Market Snapshot
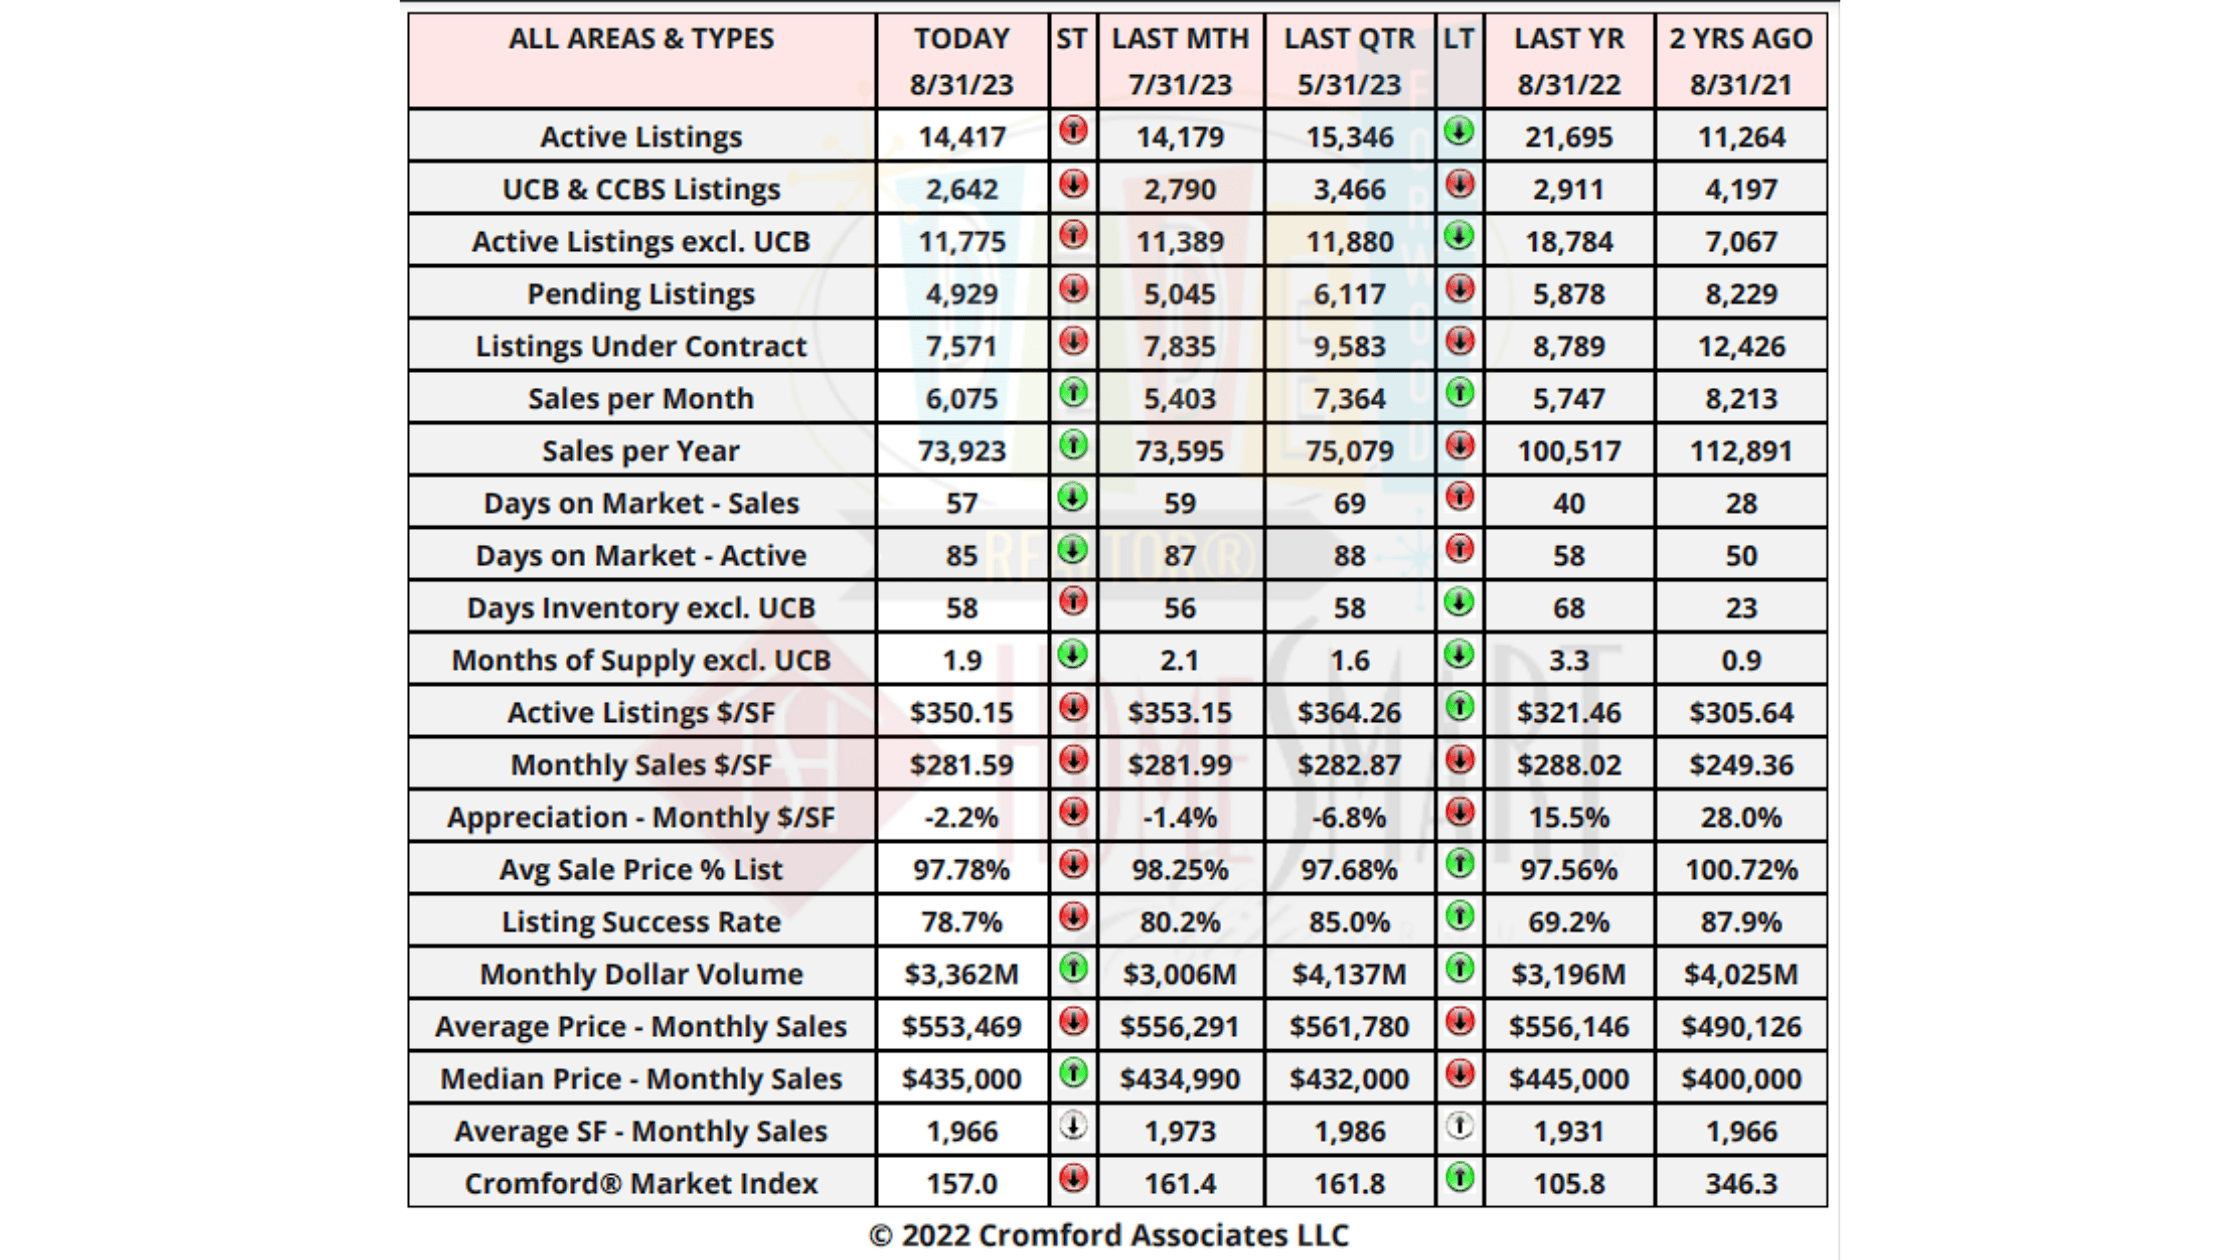
Active listings are up, Under contract and pending listings are slightly down. Sales per month are slightly up as are sales per year. Days on Market is down (yay), days of inventory is slightly up, as is months of supply (1.9). Active listings $/sf is down slightly, but monthly sales $/sf is up. Appreciation is (slightly) down.
[market_stats title=”Current Inventory” type=”inventory” display=”ActiveListings,NewListings” property_type=”A”]
[market_stats title=”Prices” type=”price” display=”ActiveAverageListPrice,NewAverageListPrice,PendedAverageListPrice,SoldAverageListPrice,SoldAverageSoldPrice,ActiveMedianListPrice,NewMedianListPrice” property_type=”A”]
[market_stats title=”Days on Market” type=”dom” display=”AverageCdom” property_type=”A”]
[market_stats title=”Sales Volume” type=”volume” display=”ActiveListVolume,NewListVolume” property_type=”A”]
[idx_slideshow title=”New to the market” link=”default” horizontal=”1″ vertical=”1″ auto_rotate=”2000″ source=”location” property_type=”A” display=”new” sort=”recently_changed” destination=”local” send_to=”photo”]
[idx_slideshow title=”Open Houses” link=”default” horizontal=”1″ vertical=”1″ auto_rotate=”2000″ source=”location” property_type=”A” display=”open_houses” sort=”recently_changed” destination=”local” days=”3″ send_to=”photo”]
National Real Estate News in Brief
We deserved a break, and we got one. After avg. 30-yr mortgage rates rose to nearly 7.5% last week, they’ve quickly dropped back to near 7% on economic data that evidenced a slowing economy and dovish (‘we’ve done enough’) comments from existing and past Federal Reserve presidents.
Lots of jobs data this week. We started with the JOLTs (job openings) report, which showed total job openings dropping 4% MoM and 22% YoY to 8.8 million. That’s still a big number, but it’s 27% below the peak of 12.0 million in early 2022. [BLS]
Then payroll processor ADP released their monthly employment report. Private employers added 177,000 jobs in August. That was both below expectations and a good deal lower than the +312,000 reported in July and +455,000 in June. Average annual pay increases eased to 5.9% (down from 7.8% in September 2022). [ADP]
The big BLS (Bureau of Labor Statistics) monthly employment report will come out on Friday (today). Wall Street expectations are for jobs growth of 148,000. If that turns out to be true, it would be the smallest increase since late-2019…and would likely cheer the bond market. [BLS]
The Conference Board’s Consumer Confidence Index dropped from 114 in July to 106.1. That was way below expectations and reflected higher prices (especially gasoline), rising interest rates, and falling stock markets during the month. Within that, the Expectations Index dropped from 88 to 80.2. A reading of 80 or below historically signals a recession within the next year. [Conference Board]
The PCE (consumer inflation) figure comes out after the CPI release, so it’s rarely a huge surprise. In July, “headline” PCE inflation rose to 3.3% (from 3.0%) in June, and “core” PCE (excluding fuel & food) rose from 4.1% to 4.2%. Should we be concerned that inflation is now heading up again? No. With shelter costs (rent etc.) leading the way down, “headline” could drop below 3% by September. [BEA]

Apartment List said that annual rent growth was down 1.2% YoY in August — the first negative figure since the beginning of the pandemic. With this in mind, it’s quite incredible that the ‘shelter’ (rent) component included in CPI and PCE is running at +7–9%…that’s how significant the lags are! [Apartment List]
More doves taking roost in the Fed rafters. Atlanta Fed president Raphael Bostic said that “policy is [already] appropriately restrictive” and ex-Boston Fed president Eric Rosengren said that “there’s no reason to hike further from here” as long as inflation is heading towards the Fed’s 2% target.
We get three GDP numbers each quarter (advance, preliminary and final). The advance number for 2Q 2023 was 2.4%. The preliminary number just came out: real GDP growth was revised down to 2.0%. That’s not a disaster (it’s still positive after all), but it does make you wonder: if US consumers are indeed losing their mojo, how will the economy keep growing? [BEA]
The NAR’s July pending sales index rose 0.9% MoM to 77.6. That was a positive surprise, as most people (me included) expected a decline given the prevailing mortgage rates (high) and inventory (low) during the month. But before we get too excited, know this: the index has declined MoM 13 times in the last 18 months, and an index level of 77.6 suggests transaction activity on par with 2008. [NAR]

Downward GDP revision + slower job growth + dovish Fed commentary = a happier bond market. And when mortgage bond prices go up, yields go down. And when MBS yields go down, mortgage rates can follow them lower. Last week, average mortgage rates hit a new, two-decade high of 7.49%. Today, we’re looking at rates closer to 7%. Quite a move!
On the Case (Shiller)
In June 2023, the national index hit 304.64, just a whisker short of the June 2022 peak of 304.82. In other words, the very modest peak-to-trough decline in the index of 2.7% has already been erased! We will almost certainly hit a new record next month.

Looking at the 20 big city indices, there was a lot of great news:
- The Phoenix home price index rose for the first time in 8–9 months. As a result, all 20 of the big city indices saw month-over-month gains in June.
- Many of the cities that saw the sharpest peak-to-trough declines are now seeing rapid recoveries (San Diego +1.5% MoM, Seattle +1.4% MoM, San Francisco +0.9% MoM)
- Boston, Miami and Washington D.C. all hit new highs in June (having erased the modest price declines in the second half of 2022). That means that 10 of the 20 big city indices are at record highs.
- Tampa (-1.6% from its July 2022 peak) and Los Angeles (-2.4% from its May 2022 peak) will likely hit new records in the next 2 months.

My Take: The new report covers home sales during the period April to June 2023. This means the typical home sale closed in mid May and no sales from the third quarter were included..
We should remember that this makes the Case-Shiller Index just over 3 months out-of-date on the day it is published and just over 4 months out of date before the next report is issued.
We are now seeing all 20 cities showing rising prices for the last few months, with a higher index for Phoenix for the fifth month in a row.
Comparing with the previous month’s series we see the following changes:
Cleveland +1.54% Chicago +1.39% Miami +1.36% Boston +1.27% Atlanta +1.27% Charlotte +1.24% Phoenix +1.13% San Diego +1.12% Detroit +1.06% New York +1.06% Minneapolis 1.04% Las Vegas +0.94% Los Angeles +0.86% Seattle +0.84% Portland +0.77% Washington +0.72% Dallas +0.71% Tampa +0.48% Denver +0.43% San Francisco +0.15%
Phoenix has risen strongly in this table over the last 2 months, from 20th In June to 16th place in July and 7th place in August. The national average increase month to month was +0.93%, so Phoenix was a little ahead of that standard.
All 20 of the 20 cities are showing positive price appreciation month to month and several are now appreciating at a fast pace, particularly the Northern and Southeastern cities.
The national average is -1.2% year over year. A year ago is when pricing peaked for the Case-Shiller Index, which lags the real market by several months. So comparisons will get easier from here on.
This is not exactly the 40% crash predicted on some YouTube channels 12 months ago. They are still predicting house prices will crash 40%. They can’t help themselves. It is the only story that gets views now that their forecasting credibility is at rock bottom.
Why are the Jobs Numbers so Important?
The Fed wants more than just lower inflation. Jerome Powell’s Christmas wish list also includes a ‘looser’ job market (higher unemployment) and a housing market ‘reset’ (lower home prices). Since both these items feed into inflation (via wages and rental rates), the idea is that higher unemployment and lower home prices will help keep inflation sustainably low.
But Mr. Powell isn’t likely to get lower home prices, and to be honest, it’s the Fed’s fault. By keeping rates so low for so long during the pandemic, basically everybody — including my mother — was able to access bargain basement mortgage rates. Millions of would-be sellers feel ‘locked in’ by their low rates and new listings have cratered. Both demand and supply have dropped, but supply has fallen more, so prices are trending up.
But he CAN get a looser job market, and so Mr. Powell is playing chicken with the economy, hoping to slow economic activity just enough — but without causing a recession. Unfortunately, history suggests that this is very, very difficult to achieve. Most major tightening campaigns (like the one we’re technically still in) result in economic contraction. Something breaks.
Mortgage Market
After a welcome move lower (that could continue if the BLS job numbers are supportive), average 30-yr mortgage rates are currently hovering around 7%. Thanks to all the (relatively) good news over the last week, the market is now putting a 90% probability on the Fed NOT hiking rates at the next FMOC meeting on September 20. Will it be just another skip? Or a full stop?

They Said It:
“This month’s [jobs] numbers are consistent with the pace of job creation before the pandemic. After two years of exceptional gains tied to the recovery, we’re moving toward more sustainable growth in pay and employment as the economic effects of the pandemic recede.” — Nela Richardson, ADP’s Chief Economist.
“Expectations for the next six months tumbled back near the recession threshold of 80, reflecting less confidence about future business conditions, job availability, and incomes. Consumers may be hearing more bad news about corporate earnings, while job openings are narrowing, and interest rates continue to rise — making big-ticket items more expensive.” — The Conference Board
DeDe’s Social Media this Week:
My Social Media is all about educating, informing and entertaining, so check out my social media and my you tube to always be informed. Have a content idea or a question for me? Reach out and I’ll cover it next time!


Here’s your Links for This Weekend’s Events:

My Website always has a list of what’s upcoming. Go here and maybe I’ll see you out there!
Get your Home Value, Wealth Snapshot and Ideas what to do with your Equity every month!
et your Home Value, wealth Snapshot and Ideas what to do with your Equity Every Month!

Join DeDe’s Secret Private Facebook group for tips, tricks, discounts and Freebies!

That’s all for this week! Know I am always here for any questions you have about Buying, Selling, or Investing in Residential Real Estate! HomeOwnership too! Vendors and Tradespeople too! Don’t hesitate to Reach out
See you next Week!
DeDe