
Mortgage rates are about to set a new peak, and that’s hitting affordability, inventory, transaction volumes and even builder confidence. This despite a halving of headline inflation over the last 10 months. When will the Fed quit playing ‘chicken’ with the economy? Here’s my Weekly Newsletter !

THE Phoenix Real Estate Market:
Hyper-Local news and info from the Cromford Report. Want something specific to your zip code or neighborhood? Reach out today!
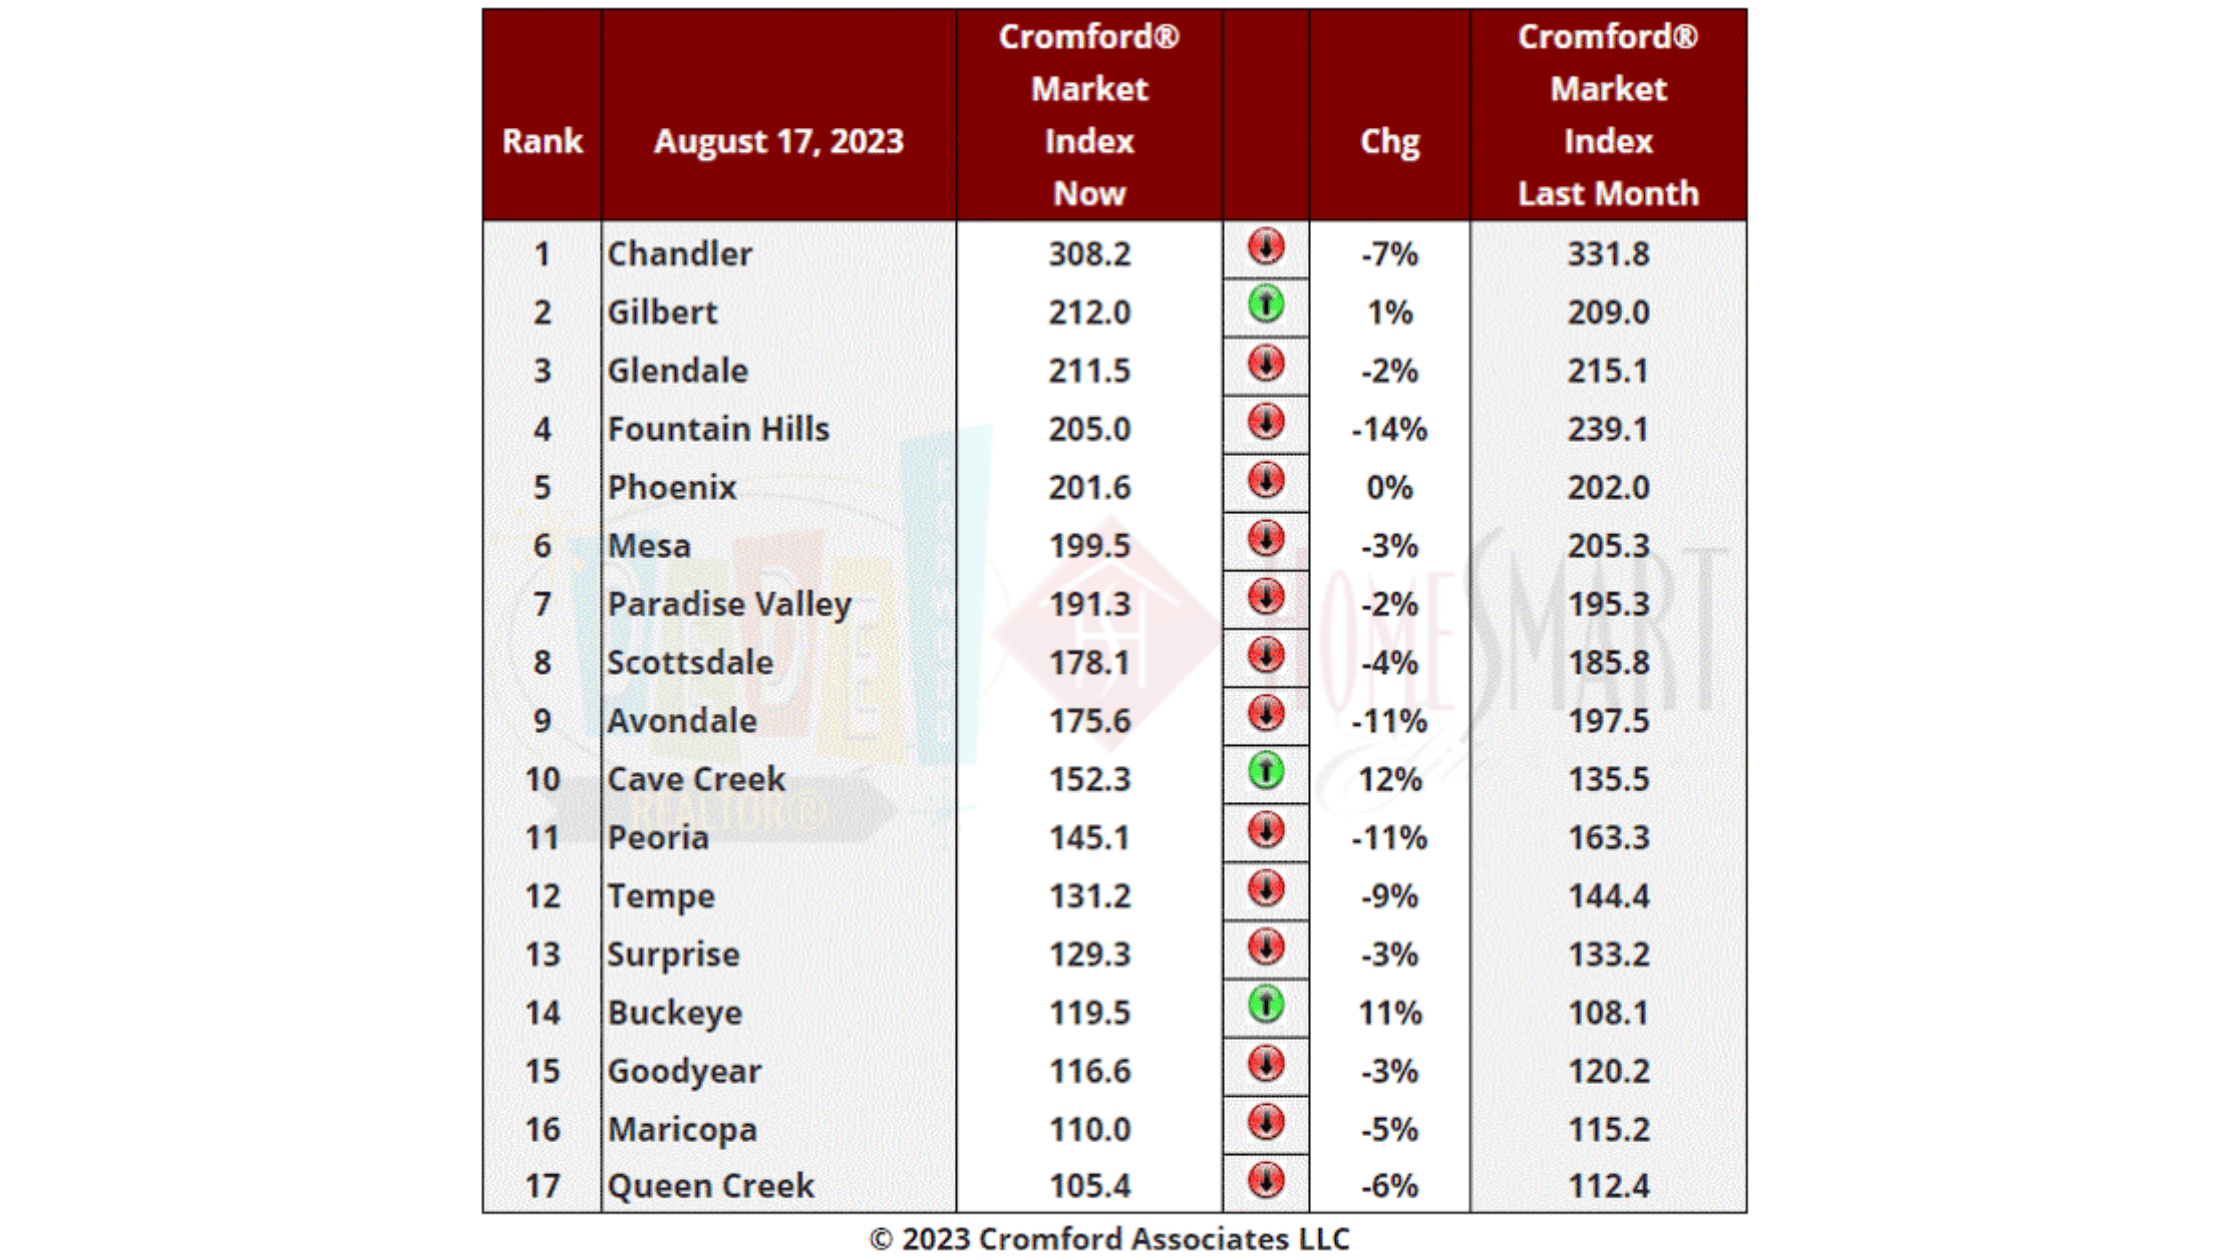
After two and a half months of a deteriorating trend, this table is starting to move in the opposite direction again. We have 3 cities that moved in a direction favorable to sellers, up from 2 last week. Gilbert is the latest recruit to the green camp.
The average CMI change in these 17 cities over the last month was -3.3%, less negative than last week when we measured -5.0%.
Buckeye is bucking the trend and has overtaken Goodyear as predicted. Cave Creek is bouncing back having been one the earliest to decline several months ago.
Most negative is Fountain Hills, a former superstar and number one. However it remains a strong seller’s market with a CMI over 200. 15 out of 17 are sellers markets with Maricopa and Queen Creek in the balanced zone.
Mortgage Delinquency Rate
The Mortgage Bankers Association (MBA) has just reported that the mortgage delinquency rate has fallen to its lowest level since they started tracking this metric in 1980. The seasonally-adjusted delinquency rate for 1 to 4 unit residential properties stood at 3.37% in the second quarter of 2023, down from 3.64% one year earlier. It was also down from 3.56% in 1Q 2023. Delinquencies fell from 1Q 2023 across all mortgage types, conventional, VA and FHA. However FHA loan delinquencies were up 10 basis points from the second quarter of 2022.
Holders of FHA loans tends to be the first to weaken when the economic going gets rough.
Delinquencies are moving up in other loan types however – particularly credit card debt and car loans.
[market_stats title=”Valley of the Sun Residental Inventory” type=”inventory” display=”ActiveListings,NewListings” property_type=”A”]
[market_stats title=”Valley of the Sun Residental Resale Prices” type=”price” display=”ActiveAverageListPrice,NewAverageListPrice,ActiveMedianListPrice,NewMedianListPrice” property_type=”A”]
[market_stats title=”Valley of the Sun Days on Market” type=”dom” display=”AverageCdom” property_type=”A”]
National Real Estate News:
Mortgage rates are about to set a new peak, and that’s hitting affordability, inventory, transaction volumes and even builder confidence. By keeping rates high (even as inflation fades), the Fed is playing ‘chicken’ with the economy, and a game of ‘chicken’ rarely ends well.
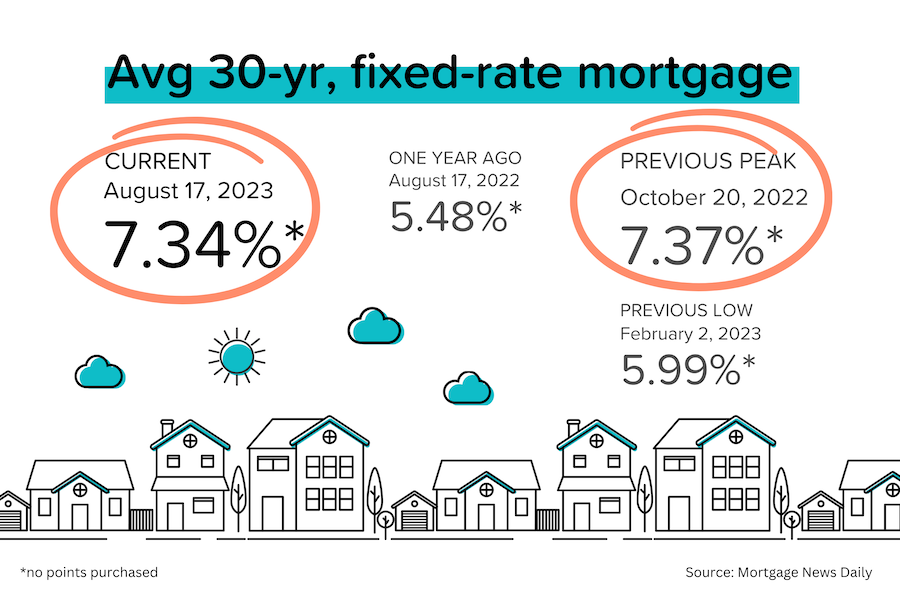
A combination of hawkish Fed minutes, rising bond yields globally, and fading recession expectations at home saw the 10-year US treasury bond move up to a 4.3% yield (levels not seen since 2008), and average 30-yr mortgage rates climb to 7.34% — just shy of the previous peak set in October 2022 (7.37%). [Mortgage News Daily]
Here was the summary statement from the last Federal Open Markets Committee (FOMC) meeting. “With inflation still well above the Committee’s longer-run goal and the labor market remaining tight, most participants continued to see significant upside risks to inflation, which could require further tightening of monetary policy.” [Federal Reserve]
For single-family homes, both the number of permits (units authorized) and starts (actual construction) rose in July. This tends to be a volatile data series from month to month, so it was heartening to see that the 3-month average for SFH permits has now risen for 5 straight months.
That’s great, but unfortunately, it’s just not enough. Builders are on pace to complete 1.3–1.4 million new housing units (77% SFH, 23% Multifamily) over the next 12 months. But households are being formed at the rate of ~2 million a year. [Census Bureau]
The US consumer won’t back down. Retail sales grew 0.7% MoM in July (+1.0% MoM excluding cars). Both figures were well ahead of expectations. The US is a consumer-driven economy, so this will provide a boost to 3Q GDP. [BEA]
Has builder confidence hit a wall? Ending 7-straight months of increases, the NAHB’s confidence index dropped 6 points to 50 in August. Higher mortgage rates and higher home prices are the obvious culprits, but labor shortages and a lack of available land for development also hit sentiment. [NAHB]

MBS Highway Housing Survey for August
MBS Highway’s August 2023 Housing Survey saw nationwide buyer activity levels, upward pricing pressure, and the pace of sales all ease for the third-straight month. This reflects both normal seasonality and the influence of 7%+ mortgage rates and low inventory levels. That said, the residential real estate market is much more competitive than at the same time last year. And the Mid-Atlantic, Northeast and Midwest regions remain hot.
- 55% of nationwide respondents in August 2023 characterized their local buyer activity as ‘Very Active’, ‘Somewhat Active’, or ‘Steady’. That’s the third month of decline (from 56% in July 2023 and 64% in June 2023). However, the figure in August 2022 was a very similar 53%, suggesting a seasonal influence.
- In August 2023, 46% of nationwide survey respondents said that homes were ‘Selling Quickly with Multiple Offers’ in their area. While that is down from 54% in July 2023 and 55% in June 2023, that same figure was only 20% in July 2022. Reasonably-priced homes are selling very quickly.
- While upward pricing pressure eased in August 2023, the trend remains very strong. 43% of nationwide respondents reported ‘Moderate’ or ‘Significant’ price increases in August 2023, versus only 28% reporting price reductions. In July 2023, those figures were 47%/21%. For comparison, in August 2022, only 16% of national respondents were seeing price increases, while 58% were seeing price decreases.
- The regional results were highly varied — driven by local supply factors and relative affordability. While buyer activity declined nationwide, it rose in the Mid-Atlantic, Northeast, Midwest, and West regions. The Mid-Atlantic was the sole region that saw a month-over-month increase in both upward pricing pressure and the pace of sales. While 80% of Mid-Atlantic region respondents said that homes were ‘Selling Quickly with Multiple Offers’, only 28% of respondents in the Southwest and Southeast said the same.

How Many Homes are For Sale in Your Area?
Just about everybody searches for homes online: Zillow, realtor.com, Redfin and Homes.com. It would be natural for people to assume that every property portal has access to the same listings. And it would also be natural for them to assume that if there were a difference, Zillow would have the most listings (because it’s the biggest).
Both assumptions would be wrong. Very wrong. I randomly picked 12 cities (large and small) across the country and typed the city names into the portals’ main search bar. Here’s what I discovered:
- The results are very different, with a wide range between the highest and lowest number of listings found. On average, the ‘low’ reading was 40% lower than the ‘high’ reading.
- In 11 cities out of 12, realtor.com had the most number of listings (though this was boosted by a large number of ‘to be built’ listings, many without addresses).
- In 6 cities out of 12, Zillow had the fewest listings. In 5 out of 12, Redfin had the fewest.
- A few cities had very similar results (Redding, CA); others were all over the place (Birmingham, AL).
- I couldn’t discern a pattern in the results between small or large cities, or this state vs. that state.

What lessons should you take away from this exercise?
- Search results can be very different depending on where you are and which portal you use.
- By getting search results from all four, you’ll start to get a feel for which of the portals seems to deliver the most comprehensive results in your city.
- If you’re actively looking to buy, make sure you get a Realtor in your corner. She will always have access to the most accurate listing count. She will know about upcoming listings (before they hit the MLS). And she will know immediately if a listing has fallen out of contract.
- In a highly competitive market (like we have today), a delay of a few days could mean that your perfect property sells before you even find out it was listed.

Mortgage Market
Average 30-yr mortgage rates hit a peak of 7.37% on October 20, 2022. Ten months later, and despite a significant drop in inflation, we hit 7.34% on August 17, 2023. (Based on how the 10-year treasury and mortgage bonds are trading today, we’ll likely set a new peak tomorrow.)
The table below is a ‘now and then’ comparison of the macroeconomic and housing situation at the time of the two mortgage rate peaks. Headline CPI and PCE (inflation for consumers) have halved over the last ten months. Core CPI and PCE are down by 20–25% (and would be much, much lower if not for the significant lags in ‘shelter’ costs). PPI (inflation for businesses) has collapsed.

Shelter costs (in CPI) grew 0.4% MoM in July 2023, and are currently running at +7.7% YoY. Here’s what the BLS had to say, “The index for shelter was by far the largest contributor to the monthly increase [in inflation], accounting for over 90% of the increase.” Well, now that the downtrend is established, shelter costs are going to keep declining, month after month, well into 2024. In fact, the research arm of the San Francisco Fed sees shelter cost inflation going negative around May 2024.
Jerome Powell and his FMOC friend should know all this, so why isn’t the Fed cutting rates (or at least officially stopping them)?:
- They want to see core consumer inflation closer to their target of 2%. We’re still a long way from there (thanks to those shelter cost lags).
- They would like to see the labor market loosening up (unemployment rising), but haven’t gotten it.
- They were hoping for a ‘reset’ in the housing market, but haven’t gotten it (thanks for the ongoing inventory shortage).
- They were willing to risk economic “pain” if that’s what it takes to defeat inflation, but GDP has been resilient. (Most forecasters have pushed out or toned down their recession expectations).
They Said It
“Sales volume couldn’t be worse. The only people moving right now are the ones who absolutely have to.” — Glenn Kelman, Redfin’s CEO
“Declining customer traffic is a reminder of the larger challenge that shelter inflation is up 7.7% from a year ago and accounted for a striking 90% of the July Consumer Price Index reading of 3.2%. The best way to bring housing inflation down and ease the housing affordability crisis is to enact policies at all levels of government that will allow builders to construct more homes to address a nationwide shortfall of approximately 1.5 million units.” — Robert Dietz, NAHB Chief Economist.
“You need to understand that the media fundamentally doesn’t understand our industry. So when they report it, they always report it in what I could a childlike manner…because here’s what you and I know — it’s always the right time to buy the right piece of real estate…Why would [consumers] think they can predict the economy. Right timing is a fool’s game…you should never walk around and in your mind go ‘It’s not a good time to buy.’ That makes no sense to me. If you study history, history says that is stupid. That is uninformed.” — Gary Keller, Keller Williams founder.
DeDe’s Social Media This Week:
My Social Media is all about educating, informing and entertaining, so check out my social media and my you tube to always be informed. Have a content idea or a question for me? Reach out and I’ll cover it next time!


Here’s your links for this weekend’s events!

My Website always has a list of what’s upcoming. Go here and maybe I’ll see you out there!
Get your Home Value, wealth Snapshot and Ideas what to do with your Equity Every Month!

Join DeDe’s Secret Private Facebook group for tips, tricks, discounts and Freebies!

That’s all for this week! Get your downloadable copy of my newsletter here. Know I am always here for any questions you have about Buying, Selling, or Investing in Residential Real Estate! HomeOwnership too! Vendors and Tradespeople too! Don’t hesitate to Reach out
See you next Week!
DeDe